Get Matched With Online Colleges
The University of Montana (UM) is a public research institution located in Missoula, Montana. Founded in 1893, it is the flagship facility for the Montana University System. The Princeton Review has included the school in its list of top four-year colleges and universities in North America every year since 2014.
Compare Popular Online Programs
Search All Programs
Overview of The University of Montana (UM)
A steward of the state, its history, and the future, the University of Montana approaches everything with creativity. Dedicated to driving forward together, the institution works to affect change that is right for people and the environment. Eager to cultivate an educated, engaged, and vibrant community, the school integrates the liberal arts and sciences into undergraduate, graduate, and professional studies to shape global citizens committed to expanding the boundaries of knowledge.
The student population is 10,106. Of those, 7,223 are pursuing undergraduate degrees. The University of Montana also employs 554 full-time and 269 part-time faculty members. While the majority of these professionals provide academic instruction, 196 spend time performing research and public service. Additionally, the institution maintains 460 graduate assistants, 316 of whom provide instruction support and 144 who conduct research. The overall student-to-faculty ratio is 15:1, which is average for colleges and universities in the United States.
General Information
| School Type | Public |
|---|---|
| Campus Setting | City: Small |
| Campus Housing | Yes |
| Student Faculty Ratio | 15:1 |
| Graduation Rate | 48% |
| Year Founded | 1893 |

Student Enrollment
Total Students10,106
7,223
2,883
Undergraduate Student
Male 3,034
Female 4,189
Graduate Student
Male 1,211
Female 1,672
Explore Map
Top Rankings For The University of Montana
UM Acceptance Rate and Admissions
APPLICATIONS7,233
ACCEPTANCE5,931
Acceptance Rate82%
Enrollment 1,542
| Admissions | |
|---|---|
| Application Fee | $30 |
| High School GPA | Required |
| High School Rank | Considered But Not Required |
| High School Transcripts | Required |
| College Prep Courses | Required |
| Recommendations | NA |
| SAT/ACT | Considered But Not Required |
| TOEFL (Test of English as a Foreign Language) | Required |
| Application Deadline | July 31 |
| Common Application Accepted | Yes |
UM Tuition Cost & Financial Aid
The cost of attending the University of Montana depends on residency. In-state undergraduate students enrolled in 12 or more credit hours per semester can expect to pay $25,534 per year. Notably, this is the total cost of attendance and includes tuition, fees, living in university residence halls, and having a university dining plan. Out-of-state students enrolled in the same number of courses, however, have an estimated total cost of attendance of $48,936.
Notably, the University of Montana offers a Western Undergraduate Exchange (WUE) program. The WUE is awarded to incoming students through the admission process. This is a highly competitive, merit-based scholarships resulting in reduced tuition for qualifying out-of-state students. The estimated total cost of attendance for these students is $30,048.
Costs for attending graduate school at the University of Montana are also different. In-state graduate students enrolled in 12 or more credit hours per semester can expect to pay a total cost of attendance of $30,270 per year. The amount is lower when taking fewer classes; those enrolled in nine to 11 credit hours per semester can expect to pay a total of $28,222 for the academic year. Out-of-state students enrolled in 12 or more credit hours, however, have an estimated total cost of attendance of $55,780. Non-residents enrolled in nine to 11 credit hours per semester can expect to pay a total of $47,732 for the academic year.
At the University of Montana, the primary forms of financial aid are grants, loans, and work study. Those seeking to apply for financial aid must do so by completing the Free Application for Federal Student Aid (FAFSA). While this application helps determine eligibility for federal aid, merit-based aid is considered separately. All new incoming students are automatically considered for Montana resident, non-resident, and WUE scholarships. The application for admission serves as an application for these awards.
During the 2020-2021 academic year, 98% of beginning students entering postsecondary education at the University of Montana for the first time received some form of financial assistance. Most received some amount in grants and/or scholarships, but 45% still required federal and/or private student loans.
| Average net price | 2020-2021 |
|---|---|
| Net Price | $15,228 |
| Average Total Aid | $6,340 |
| Students Receiving Financial Aid | 98% |
| Room & Board | $11,054 |
Sticker Price
- Tuition In-State - $7,432
- Tuition Out-of-State - $28,416
- Books and Supplies - $1,100
- Room & Board - $11,054
- Other - $3,450
Popular Academic Programs at UM
As the state’s flagship higher education institution, the University of Montana sets a high bar for academic studies, creative accomplishments, and scientific exploration which benefits students, the community, and the world at large. Students receive an exceptional education in a broad range of subjects that include arts, sciences, graduate, and postdoctoral study, as well as professional training. Those enrolled can choose from a wide array of courses, degrees, minors, and majors to help them fulfill their academic goals.
Areas of study are offered in the following schools and colleges:
- College of the Arts and Media
- College of Business
- Phyllis J. Washington College of Education
- W.A. Franke College of Forestry and Conservation
- College of Health
- Alexander Blewett III School of Law
- College of Humanities and Sciences
- Graduate School
- Missoula College
As of fall 2021, the University of Montana had first-year, undergraduate retention rate of 75% for full-time students. Notably, the national average is 68% for all higher education institutions. This indicates that the majority of full-time students enrolled at the university were happy enough with their experiences to return the following year.
The overall graduation rate for first-time students who began their studies in 2015 was 48%. Graduation rates demonstrate how frequently students complete their degrees or certificate programs within 150% of standard time, which is approximately six years. Most students strive to graduate within four years, however. Approximately 33% of full-time, first-time students who began their studies in 2015 were able to complete requirements within this timeframe. The institution’s transfer-out rate was not provided, which otherwise may explain the apparently low graduation rates since students who transfer are not counted, even if they graduate from elsewhere.
Pace University is accredited by the Northwest Commission on Colleges and Universities (NWCCU), which is recognized by the US Secretary of Education and the Council for Higher Education Accreditation (CHEA).
Retention
Rate
4 year
Graduation
Rate
6 year
Graduation
Rate
Student Population Total
Student Population 10,106
7,223
2,883
Most Popular Programs & Majors
(# of Diplomas Awarded by Subject)
| All Business Majors | 233 Total Graduates / 18% |
|---|---|
| Management Information Systems, General | 75 Graduates |
| Business Administration and Management, General | 55 Graduates |
| Marketing/Marketing Management, General | 40 Graduates |
| Accounting | 38 Graduates |
| Finance, General | 21 Graduates |
| All Natural Resources and Conservation Majors | 179 Total Graduates / 14% |
| Wildlife, Fish and Wildlands Science and Management | 64 Graduates |
| Natural Resources/Conservation, General | 39 Graduates |
| Environmental Studies | 25 Graduates |
| Environmental/Natural Resource Recreation and Tourism | 20 Graduates |
| Forest Management/Forest Resources Management | 16 Graduates |
| All Biological and Biomedical Majors | 149 Total Graduates / 11% |
| Biology/Biological Sciences, General | 67 Graduates |
| Exercise Physiology and Kinesiology | 61 Graduates |
| Neuroscience | 9 Graduates |
| Biochemistry | 7 Graduates |
| Microbiology, General | 5 Graduates |
| All Social Sciences Majors | 136 Total Graduates / 10% |
| Sociology, General | 47 Graduates |
| Political Science and Government, General | 37 Graduates |
| Anthropology, General | 29 Graduates |
| Economics, General | 12 Graduates |
| Geography | 11 Graduates |
| All Visual and Performing Arts Majors | 119 Total Graduates / 9% |
| Cinematography and Film/Video Production | 39 Graduates |
| Music, Other | 25 Graduates |
| Drama and Dramatics/Theatre Arts, General | 24 Graduates |
| Art/Art Studies, General | 18 Graduates |
| Dance, General | 9 Graduates |
| All Other Diplomas | 38% |
Outcome & Salary
The University of Montana conducts a yearly First Destination Survey of recent graduates. Data collected is used to assess the future plans of those who have graduated from the institution and helps inform decisions moving forward. Questions pertain to employment status, continuing education enrollment, volunteer and service programs, and starting salaries. Unfortunately, the results from these surveys are not published on the University of Montana website. Those interested in obtaining this data should contact the institution directly.
Notably, University of Montana alumni do have access to a number of career resources. Graduates can access a wide variety of job search platforms and job boards. There is also a directory for those who are more advanced in their careers.
| Graduates Salary | |
|---|---|
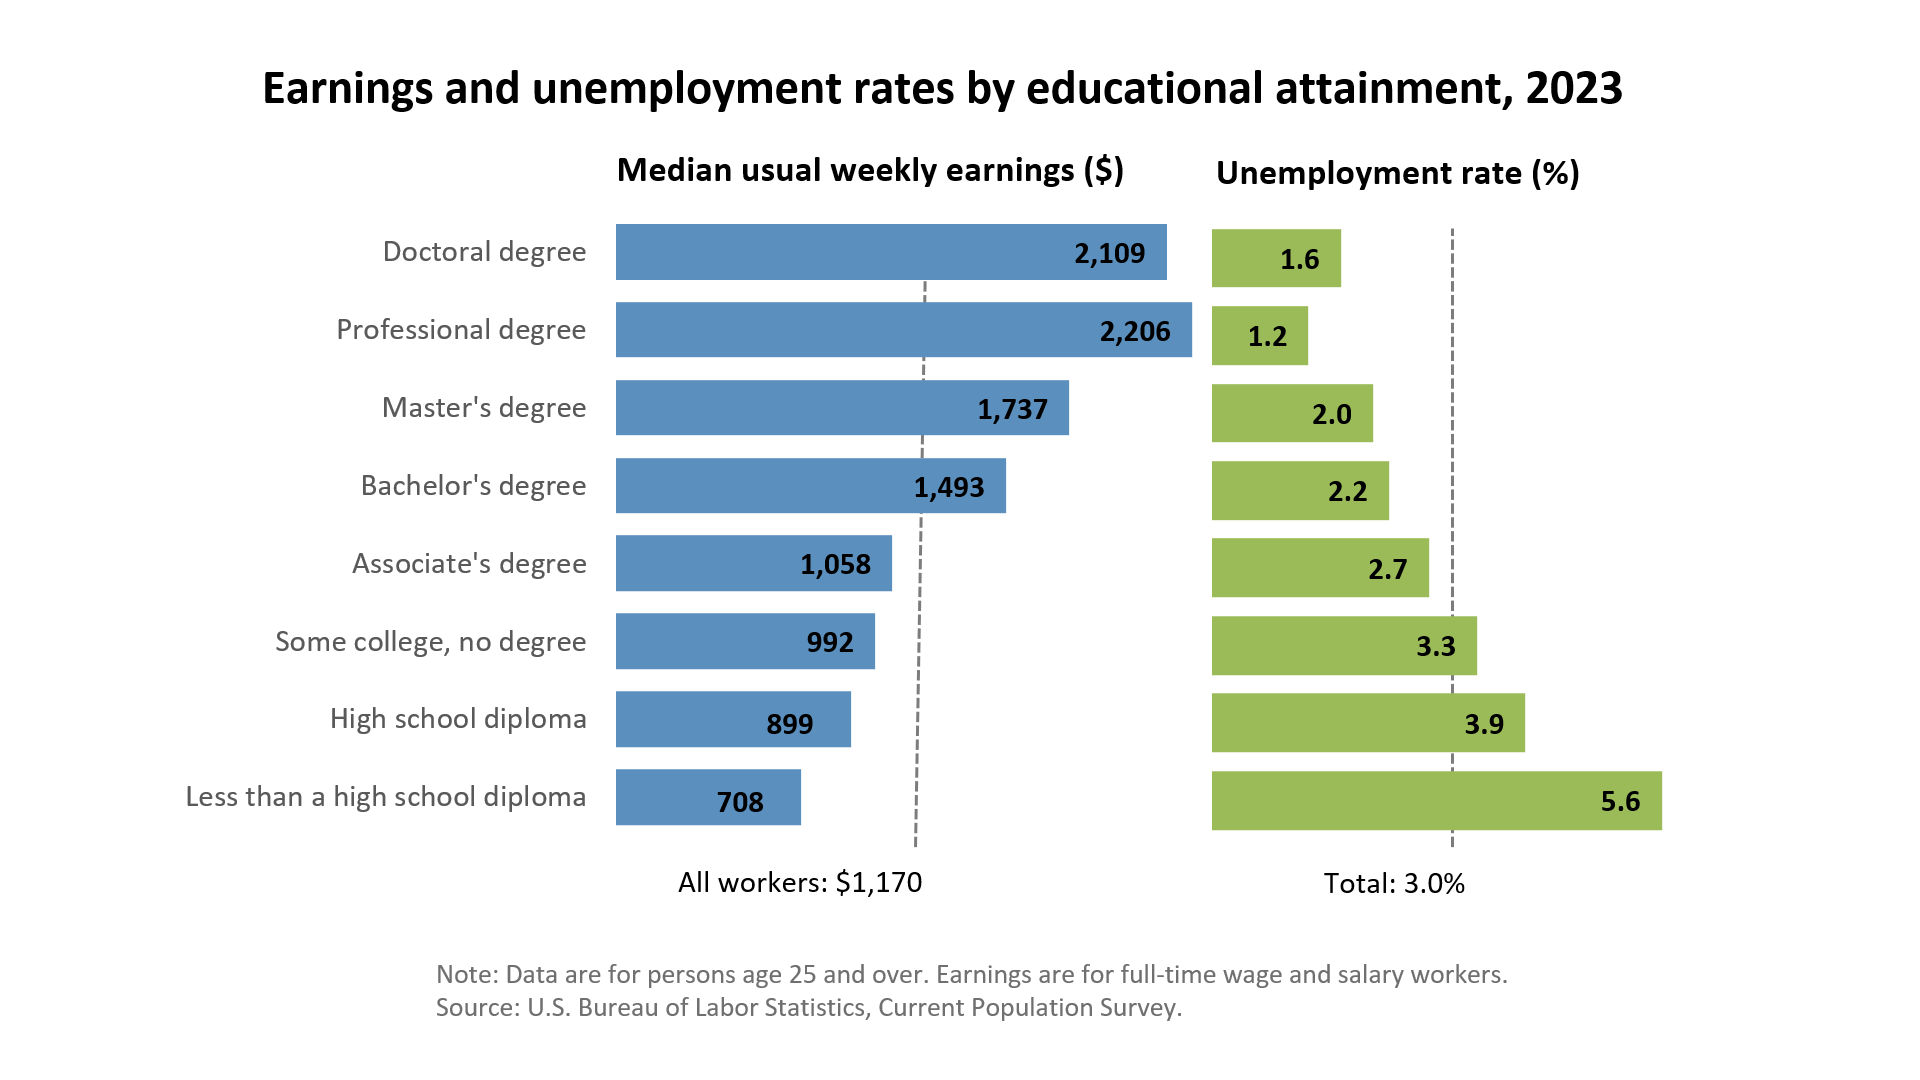
| College Grads Early Career Salary | $45,900 |
| College Grads Average Salary | $68,000 |
| College Grads Mid Career Salary | $66,000 |
| Return on Investment (ROI) | |
|---|---|
| 10 Year Salary Earnings Potential | $680,000 |
| 20 Year Salary Earnings Potential | $1,340,000 |
| Cost of Education (Net Price) 4 Year | $60,912 |
| 10 Year Projected ROI | $619,088 |
| 20 Year Projected ROI | $1,279,088 |
| No College Education Salary Comparison | |
|---|---|
| National Average Salary | $38,792 |
| 10 Year Projected Income | $387,920 |
| 20 Year Projected Income | $775,840 |

Photos & Videos
sources:
Related Top College Resources


