Get Matched With Online Colleges
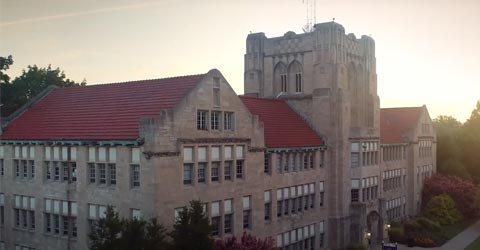
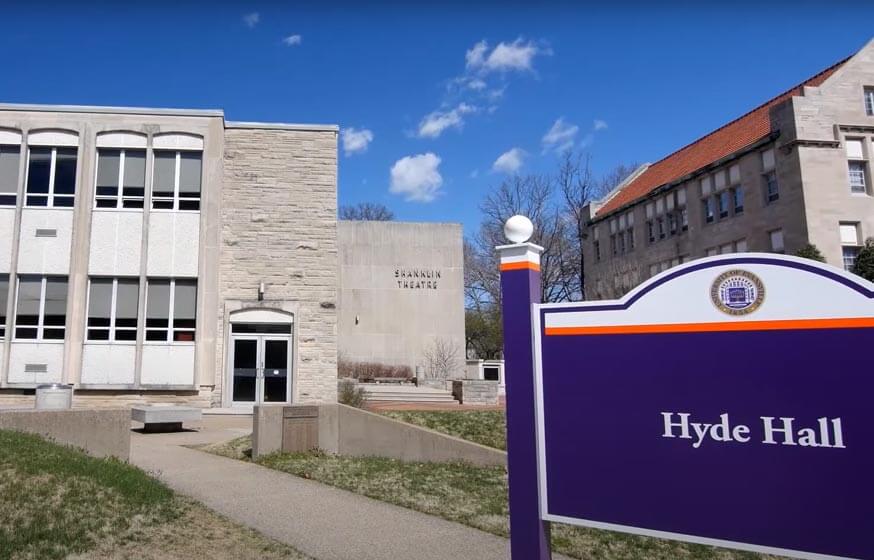
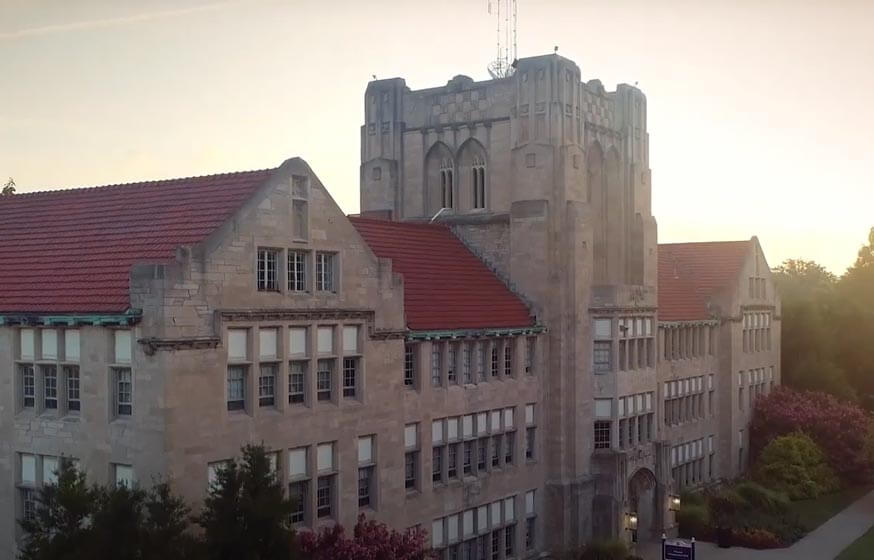
The University of Evansville welcomes you to the heartland of the United States! It’s one of those universities that confers degrees on graduates from the associate level all the way through doctorates for students who plan to go into professional practice. The campus is large, so you’ll need to do some walking around to familiarize yourself with your new surroundings. It includes quite a bit of green space between buildings, so you’ll have lots of outdoor space to study before it gets too cold to stay outside.
Search All Programs
Overview of University of Evansville (UE)
The total student population is 2,371 and most of the student body is made up of undergraduate students. You’ll easily be able to meet with your professors when you need to do so since the student-to-faculty ratio is a low 11 to 1. That means that class sizes will be easily manageable, for you and your professors.
Before your classes start, you might want to check out the midsize city of Evansville. Between nature preserves, museums and even a zoo, you’ll find lots of interesting things to do when you have time away from your studies.
General Information
| School Type | Private not-for-profit |
|---|---|
| Campus Setting | City: Midsize |
| Campus Housing | Yes |
| Student Faculty Ratio | 11:1 |
| Graduation Rate | 68% |
| Year Founded | 1854 |
Student Enrollment
Total Students2,371
2,124
247
Undergraduate Student
Male 871
Female 1,253
Graduate Student
Male 101
Female 146
Explore Map
Top Rankings For University of Evansville
UE Acceptance Rate and Admissions
APPLICATIONS4,234
ACCEPTANCE3,006
Acceptance Rate71%
Enrollment 451
| Admissions | |
|---|---|
| Application Fee | NA |
| High School GPA | Required |
| High School Rank | Considered But Not Required |
| High School Transcripts | Required |
| College Prep Courses | Recommended |
| Recommendations | Considered But Not Required |
| Formal demonstration of competencies | Considered But Not Required |
| SAT/ACT | Considered But Not Required |
| TOEFL (Test of English as a Foreign Language) | Required |
| Application Deadline | November 1 |
| Common Application Accepted | Yes |
UE Tuition Cost & Financial Aid
The question of how much your education may cost you and your family may be on your mind. You and your parents know that a college education is a good investment and the money you and they spend for your education will likely be well-spent. The total price is made up of your tuition, books, room and board, supplies, and other various costs. This comes out to $53,676.
Your financial aid can cover a big portion of that cost, but you and your family will have to pay for what’s left. What’s left after financial aid has been applied is called the average net price. Because the amount of financial aid you receive will vary depending on your family’s income, the average net price you end up being responsible for will also vary depending on your family’s income. For instance, a family earning $30,000 or less will pay around $15,212, a family earning between $75,001 and $100,000 will pay around $24,548 and a family earning more than $110,001 pays $26,585.
The full freshman class qualified for financial aid in a recent school year. On average, students received grants and scholarships at an average of $28,279 and they received an average of $24,976 in institutional grants and scholarships.
| Average net price | 2018-2019 |
|---|---|
| Net Price | $21,978 |
| Average Total Aid | $28,279 |
| Students Receiving Financial Aid | 100% |
| Room & Board | $12,770 |
Sticker Price
- Tuition In-State - $37,466
- Tuition Out-of-State - $37,466
- Books and Supplies - $1,200
- Room & Board - $12,770
- Other - $2,240
Academics
If you do decide to continue your college education there, you become part of a statistic for the university called the retention rate. This tracks the percentage of freshmen students who decide to stay for their second year. This number is 84%, which is excellent, higher than average, and indicates that the students who attend their freshmen year get everything they need and want out of their college experience.
The graduation rate is pretty good as well: the 4-year graduation rate is 55%, only a little below the national average and the 6-year graduation rate is a little higher at 68%, above the national average. Students who are getting close to graduation may decide to extend their time at the university because they switched majors in the middle of their four years or because they have been attending part-time so that they could work.
The five most popular degree programs offered here are business, management, marketing and related services; health professions and related programs; engineering; parks, recreation, leisure, and fitness studies; and visual and performing arts. While you may choose a different major, the programs mentioned here have been the most popular for other students pursuing degrees.
Retention
Rate
4 year
Graduation
Rate
6 year
Graduation
Rate
Student Population Total
Student Population 2,371
2,124
247
Most Popular Programs & Majors
(# of Diplomas Awarded by Subject)
| All Business Majors | 75 Total Graduates / 16% |
|---|---|
| Finance, General | 25 Graduates |
| Accounting | 20 Graduates |
| Business Administration and Management, General | 13 Graduates |
| Marketing/Marketing Management, General | 10 Graduates |
| Health Professions and Related Programs | 68 Total Graduates / 15% |
| Registered Nursing/Registered Nurse | 28 Graduates |
| Athletic Training/Trainer | 16 Graduates |
| Music Therapy/Therapist | 10 Graduates |
| Health/Health Care Administration/Management | 9 Graduates |
| All Engineering Majors | 61 Total Graduates / 13% |
| Mechanical Engineering | 27 Graduates |
| Electrical and Electronics Engineering | 15 Graduates |
| Civil Engineering, General | 11 Graduates |
| Computer Engineering, General | 8 Graduates |
| Parks, Recreation, Leisure, and Fitness Studies | 54 Total Graduates / 12% |
| Kinesiology and Exercise Science | 52 Graduates |
| Sport and Fitness Administration/Management | 2 Graduates |
| Visual and Performing Arts | 47 Total Graduates / 10% |
| Acting | 18 Graduates |
| Design and Visual Communications, General | 8 Graduates |
| Music Performance, General | 6 Graduates |
| Technical Theatre/Theatre Design and Technology | 4 Graduates |
| All Other Diplomas | 34% |
Outcome & Salary
Once you’ve graduated and are working, you’ll be ready to earn a decent salary. At first, your annual salary may not be as much as you may have been told what to expect but it’ll go up. University of Evansville graduate’s early career salaries average $42,800. Their mid-career salaries average around $65,200.
Ten years later, a graduate’s salary earnings potential is $645,440. Their 20-year salary earnings potential jumps considerably to $1,297,440. The 4-year cost of this education is $87,912 and this is how you can eventually measure your return on investment (ROI). Your 10-year projected ROI is $557,528 and your 20-year projected ROI is $1,209,528.
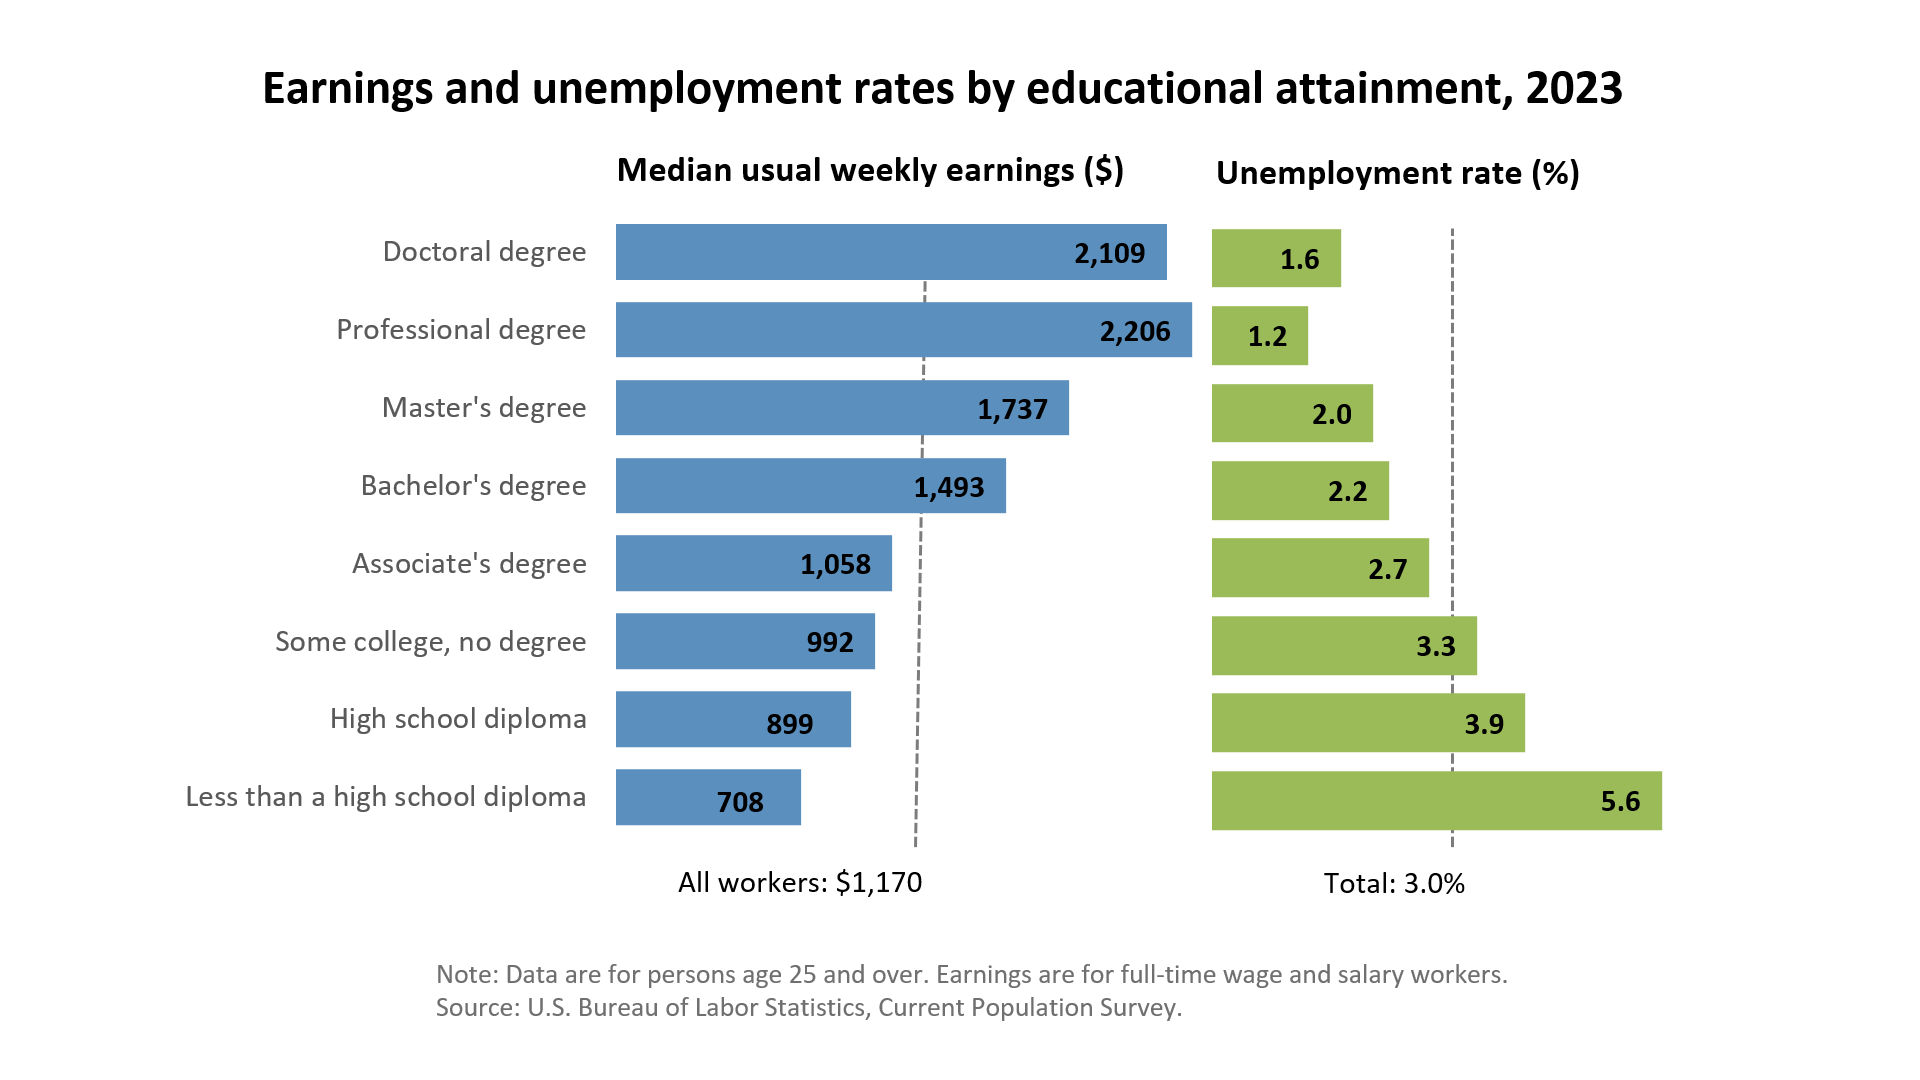
High school graduates who don’t go to college earn money, but it will most likely be less than your earnings. Their national average salary is $38,792. Their 10-year projected income is $387,920 and their 20-year projected income is $775,840.
| Graduates Salary | |
|---|---|
| College Grads Early Career Salary | $42,800 |
| College Grads Average Salary | $64,544 |
| College Grads Mid Career Salary | $65,200 |
| Return on Investment (ROI) | |
|---|---|
| 10 Year Salary Earnings Potential | $645,440 |
| 20 Year Salary Earnings Potential | $1,297,440 |
| Cost of Education (Net Price) 4 Year | $87,912 |
| 10 Year Projected ROI | $557,528 |
| 20 Year Projected ROI | $1,209,528 |
| No College Education Salary Comparison | |
|---|---|
| National Average Salary | $38,792 |
| 10 Year Projected Income | $387,920 |
| 20 Year Projected Income | $775,840 |
Related Top College Resources

