Get Matched With Online Colleges
Students considering attending the University of Tulsa may not know the importance of this, but the university is a private, not-for-profit institution affiliated with the Presbyterian Church. Being a private institution means that it is likely to cost the same for students from inside or outside the state because it is not subsidized by the state government. When students check out the campus, they’ll see that the university covers a lot of ground. That means that there is plenty of room to stretch out and study on warm sunny afternoons. However, it should still be relatively easy for them to get from one class to another, even when hundreds of other students are doing the same thing as parking lots are scattered throughout the campus.
Search All Programs
Overview of University of Tulsa
Campus housing is provided for students who want to live in the dorms. This allows them to be involved in campus activities and more easily meet fellow students. When students want to leave campus, they’ll be able to go into Tulsa, which is a large city. Here, they can find stores and restaurants, as well as movie theaters and other forms of entertainment to fill their weekends when the school doesn’t have activities going on.
For the large size of the physical campus, the student population is fairly small: 4,379. The student-to-faculty ratio is 11 to 1, which should make it much easier for students to contact their professors if they have questions or need help with a class.
General Information
| School Type | Private not-for-profit |
|---|---|
| Campus Setting | City: Large |
| Campus Housing | Yes |
| Student Faculty Ratio | 11:1 |
| Graduation Rate | 72% |
| Year Founded | 1894 |
Student Enrollment
Total Students4,379
3,268
1,111
Undergraduate Student
Male 1,765
Female 1,503
Graduate Student
Male 600
Female 511
Explore Map
Top Rankings For University of Tulsa
TU Acceptance Rate and Admissions
APPLICATIONS9,793
ACCEPTANCE3,525
Acceptance Rate36%
Enrollment 846
| Admissions | |
|---|---|
| Application Fee | $50 |
| High School GPA | Required |
| High School Rank | Recommended |
| High School Transcripts | Required |
| College Prep Courses | Recommended |
| Recommendations | Required |
| Formal demonstration of competencies | Recommended |
| SAT/ACT | Required |
| TOEFL (Test of English as a Foreign Language) | Recommended |
| Application Deadline | Rolling |
| Common Application Accepted | Yes |
Tulsa Tuition Cost & Financial Aid
Families of students looking to attend the University of Tulsa may be aware of the sticker price, which is the total cost of schooling, including room and board, books, supplies, tuition (in- or out-of-state), and other charges and fees. UT charged families an average of $61,247 during the 2019-2020 school year.
However, students may find that they may not end up paying this whole amount. As with most universities, the school tracks the net cost, which is the cost of attendance that must be paid by the student after financial aid is applied. The average net price in the 2018-2019 school year was $23,940, less than half of the sticker price. And, since financial aid is supplied based on a family’s income, you may still end up paying less than that. During the 2018-2019 school year, families earning between $48,001 and $75,000 paid around $19,396 and families earning more than $110,001 paid $27,788.
Beginning students qualified for financial aid at a rate of 98% in recent academic years. The same percentage received grants or scholarships.
| Average net price | 2018-2019 |
|---|---|
| Net Price | $23,940 |
| Average Total Aid | $33,921 |
| Students Receiving Financial Aid | 98% |
| Room & Board | $11,424 |
Sticker Price
- Tuition In-State - $42,723
- Tuition Out-of-State - $42,723
- Books and Supplies - $1,200
- Room & Board - $11,424
- Other - $5,900
Academics
Students who haven’t made a decision about their future careers may want to look at the most popular majors at the University of Tulsa. These include engineering; business, management, marketing and related support services; visual and performing arts; computer and information sciences and support services; and biological and biomedical sciences. Whether or not these are majors you are interested in, it provides a good overview of what classes a large percentage of students will be taking throughout their academic career at this school.
Students’ families may want to find the retention rate and graduation rates of schools they are considering. The retention rate is 87%; this denotes the percentage of first-year students who return to campus for their second year of school and is often used to express how happy freshman students are with the educational environment and supports offered by the school for new students. The 4-year graduation rate is a but low at 50% and the 6-year graduation rate is 69%. This percentage is made public in cooperation with the 1990 Student Right to Know Act and these numbers are close to the national averages, where the 4-year rate has steadily declined because students are taking longer to complete their degrees.
Should students need to drop classes that conflict with other commitments, such as work hours, they do have an option open to them for some courses. While evening classes are not offered here, they do provide some online sections in order to afford students some flexibility.
Retention
Rate
4 year
Graduation
Rate
6 year
Graduation
Rate
Student Population Total
Student Population 4,379
3,268
1,111
Most Popular Programs & Majors
(# of Diplomas Awarded by Subject)
| All Engineering Majors | 195 Total Graduates / 26% |
|---|---|
| Petroleum Engineering | 72 Graduates |
| Mechanical Engineering | 60 Graduates |
| Chemical Engineering | 37 Graduates |
| Electrical and Electronics Engineering | 20 Graduates |
| All Business Majors | 154 Total Graduates / 20% |
| Finance, General | 44 Graduates |
| Business Administration and Management, General | 33 Graduates |
| Accounting | 29 Graduates |
| Management Information Systems, General | 21 Graduates |
| Visual and Performing Arts | 58 Total Graduates / 8% |
| Fine/Studio Arts, General | 14 Graduates |
| Music, General | 10 Graduates |
| Film/Cinema/Video Studies | 9 Graduates |
| Voice and Opera | 7 Graduates |
| All Computer Information Science Majors | 51 Total Graduates /7% |
| Computer Science | 36 Graduates |
| Modeling, Virtual Environments and Simulation | 8 Graduates |
| Information Technology | 7 Graduates |
| All Biological & Biomedical Majors | 48 Total Graduates / 6% |
| Biology/Biological Sciences, General | 26 Graduates |
| Biochemistry | 22 Graduates |
| All Other Diplomas | 33% |
Outcome & Salary
Graduates of the University of Tulsa find jobs that pay an average of $65,500 in their early careers. And their mid-career salaries increase to $111,600. The 10-year salary earnings potential of a graduate from the University of Tulsa is $749,250, and their 20-year earnings potential is $1885,250. With the average four-year cost of education being $95,760 on average; this allows us to estimate their return on investment (ROI).
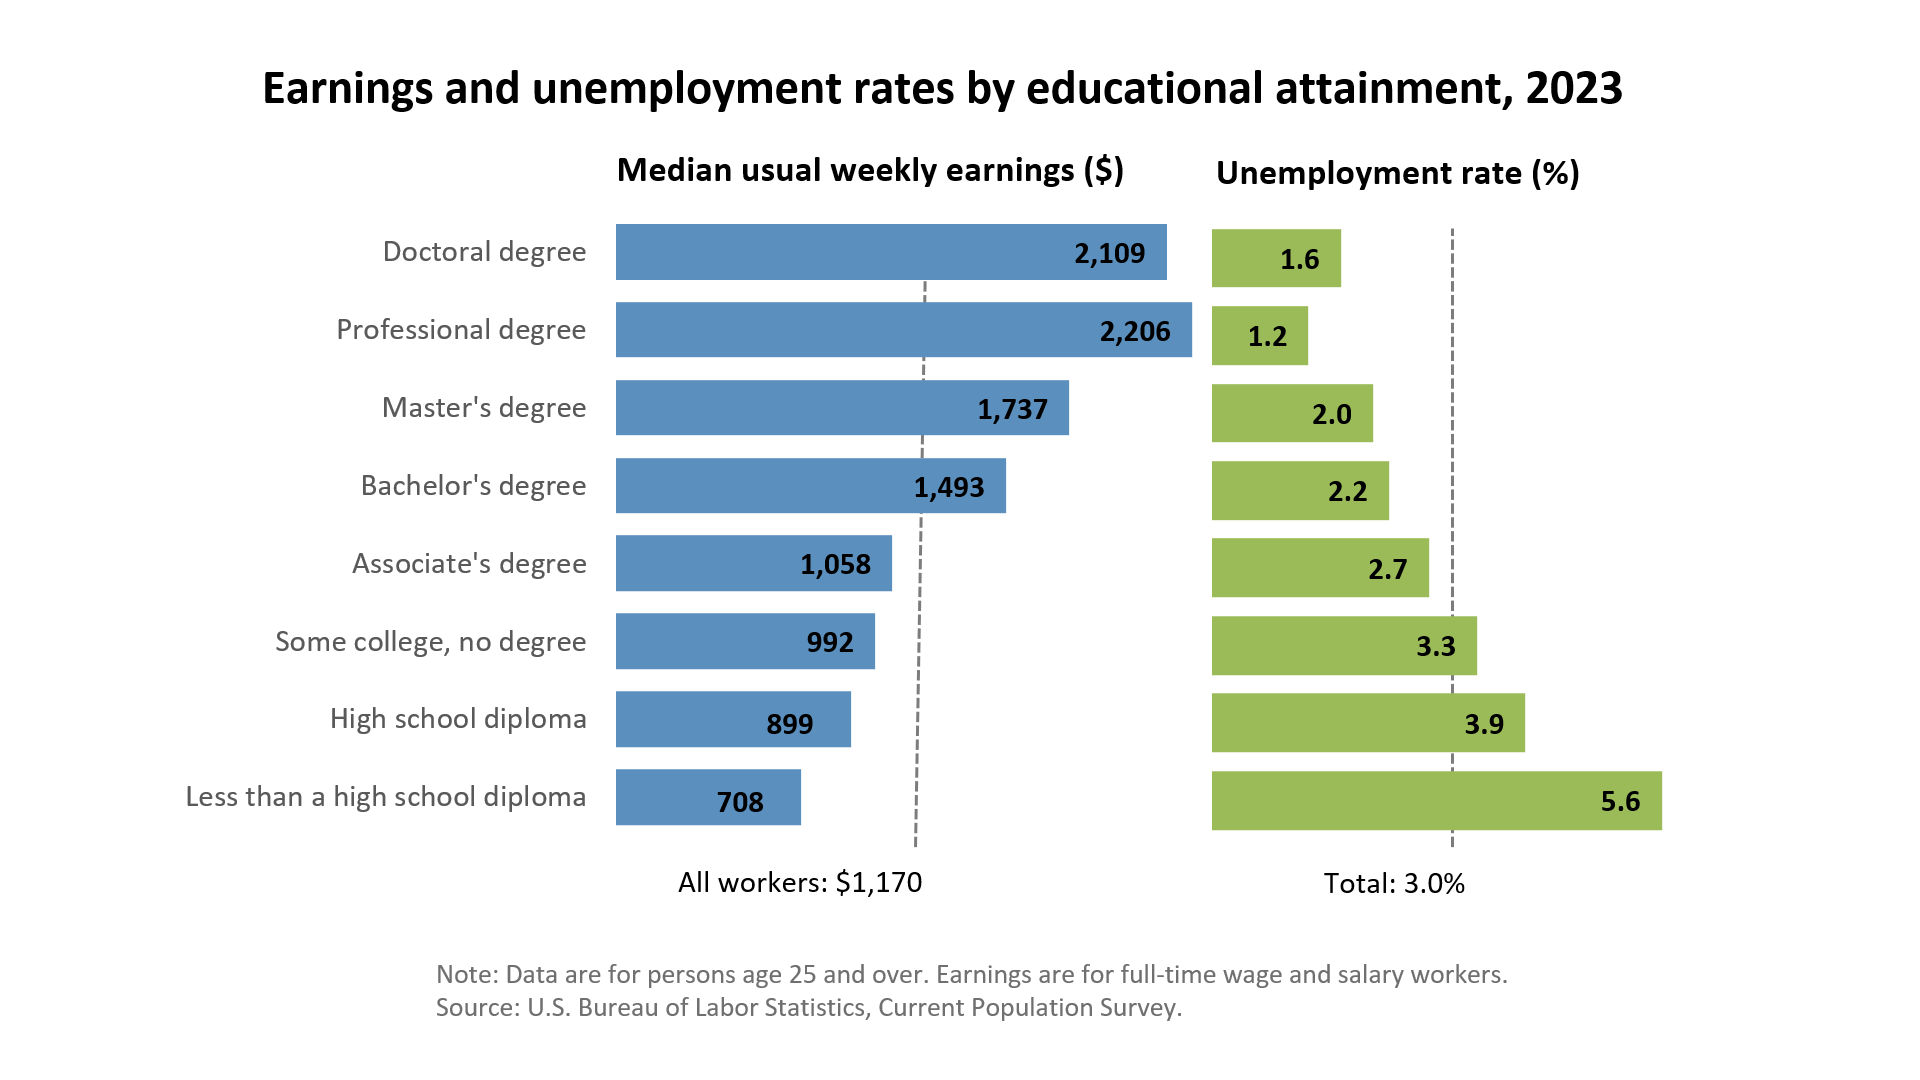
Based on these numbers, graduate’s 10-year projected ROI is $653,490 and their 20-year projected ROI is $1,769,490. On the other hand, high school graduates who do not go to college earn a national average salary of $38,792. Their 10-year projected income is $387,920 and their 20-year projected income is $775,840.
| Graduates Salary | |
|---|---|
| College Grads Early Career Salary | $65,500 |
| College Grads Average Salary | $74,925 |
| College Grads Mid Career Salary | $111,600 |
| Return on Investment (ROI) | |
|---|---|
| 10 Year Salary Earnings Potential | $749,250 |
| 20 Year Salary Earnings Potential | $1,865,250 |
| Cost of Education (Net Price) 4 Year | $95,760 |
| 10 Year Projected ROI | $653,490 |
| 20 Year Projected ROI | $1,769,490 |
| No College Education Salary Comparison | |
|---|---|
| National Average Salary | $38,792 |
| 10 Year Projected Income | $387,920 |
| 20 Year Projected Income | $775,840 |
Photos & Videos
sources:
Related Top College Resources

