Get Matched With Online Colleges
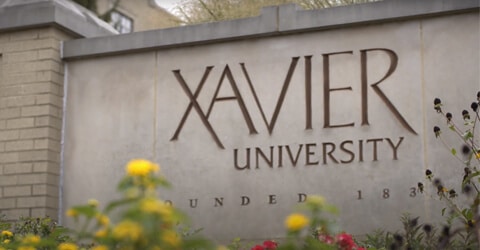
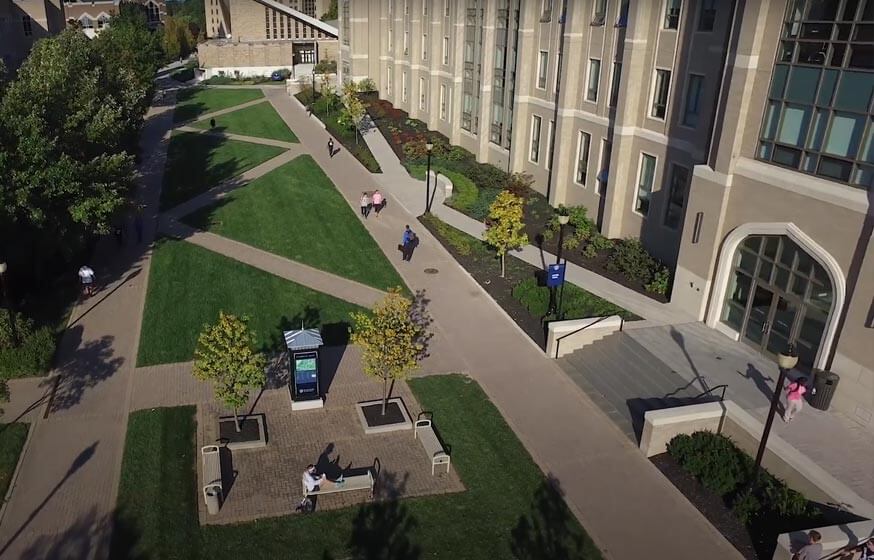
The student population at Xavier University is just under 7,000, which puts the student population is a little above the numbers for many other private universities. The campus itself is compact, making it easier for you to get from class to class and back to your dorm room.
Search All Programs
Overview of Xavier University
This is a Roman Catholic-affiliated university, so expect to see a Roman Catholic chapel on campus—Bellarmine Chapel. While outside on campus, you should be able to see a good portion of the campus from where you’re standing. Xavier University does offer campus housing, so you’ll be able to save your money for books, supplies, and other charges.
When you have the chance to leave campus, you should spend some time on public transportation so you can see what stores and restaurants you’ll be able to find. In a city the size of Cincinnati, you’re sure to find plenty of places you want to go and restaurants you’ll enjoy eating at with friends. And, if you want a good, relaxing getaway, try visiting the Cincinnati Zoo and Botanical Garden.
General Information
| School Type | Private not-for-profit |
|---|---|
| Campus Setting | City: Large |
| Campus Housing | Yes |
| Student Faculty Ratio | 11:1 |
| Graduation Rate | 73% |
| Year Founded | 1831 |

Student Enrollment
Total Students6,973
5,043
1,930
Undergraduate Student
Male 2,320
Female 2,723
Graduate Student
Male 888
Female 1,042
Explore Map
Top Rankings For Xavier University
Xavier Acceptance Rate and Admissions
APPLICATIONS14,758
ACCEPTANCE11,216
Acceptance Rate76%
Enrollment 1,234
| Admissions | |
|---|---|
| Application Fee | $35 |
| High School GPA | Required |
| High School Rank | Recommended |
| High School Transcripts | Required |
| College Prep Courses | Recommended |
| Recommendations | Required |
| SAT/ACT | Considered But Not Required |
| TOEFL (Test of English as a Foreign Language) | NA |
| Application Deadline | February 1 |
| Common Application Accepted | Yes |
Xavier Tuition Cost & Financial Aid
All of your college-related costs can be rolled together into one number, your total cost for the year. At Xavier University the largest of these costs will be your tuition; in- and out-of-state tuition was $40,450 for a recent academic year. Then, you add in your room and board, books, supplies, and other various costs and you have a bill of around $58,260 total.
Luckily, you and your parents don’t necessarily have to pay for all of that. If you qualify for financial aid, you’ll be able to apply that to what you owe for school. After financial aid is applied, you’re left with the average net price. For a recent academic year, this amount was $32,429. And even better, you’ll be eligible for financial aid based on your family’s annual income, which means that the less your annual income, the more you can get in financial aid that you may not even have to pay back. The school keeps track of how much families usually pay based on their income and it breaks down as follows.
- Families earning up to $30,000 pay around $25,756
- Families earning between $30,001 and $48,000 pay around $29,171
- Families earning between $48,001 to $75,000 pay around $30,913
- Families earning between $75,001 and $110,000 pay around $32,231
- Families earning more than $110,001 pay around $34,043
Also, in a recent year, the entire freshman class qualified for financial aid. Students received an average of $21,881 in grants and scholarships. Almost every freshman received an average of $28,985 in institutional grants and scholarships.
| Average net price | 2018-2019 |
|---|---|
| Net Price | $32,429 |
| Average Total Aid | $21,881 |
| Students Receiving Financial Aid | 100% |
| Room & Board | $13,310 |
Sticker Price
- Tuition In-State - $40,450
- Tuition Out-of-State - $40,450
- Books and Supplies - $1,300
- Room & Board - $13,310
- Other - $3,200
Academics
Will you stay or transfer at the end of your first year? If you decide you’re staying, then you’ll be part of an important percentage for the university. This is the retention rate, which is 83% at Xavier University, an excellent number that shows that there is a greater-than-chance possibility that you too will enjoy you classes, professor, and time spent here if you choose to attend.
The 4-year graduation rate is 67%, which is a bit above the national average. The 6-year graduation rate is even better at 73%. And with a student population nearing 7,000, the student-to-faculty ratio is a surprisingly low 11 to 1. So, you shouldn’t have any trouble contacting your professors during their office hours, or even asking them a few questions after class.
If you decide to take a work-study or part-time job off campus, you may run into trouble trying to attend all of your classes. Should you drop them and try to pick them up in a different semester? No—ask your adviser what they suggest. They may let you know that you can take evening classes. Or you may choose to take one or both of those classes online (distance learning). Fill out drop-add slips so you can drop the sections you can’t attend and add the sections you want to take.
The most popular degree programs offered are business, management, marketing, and related support services; health professions and related programs; liberal arts and sciences, general studies, and humanities; social sciences; and psychology.
Retention
Rate
4 year
Graduation
Rate
6 year
Graduation
Rate
Student Population Total
Student Population 6,973
5,043
1,930
Most Popular Programs & Majors
(# of Diplomas Awarded by Subject)
| All Business Majors | 282 Total Graduates / 25% |
|---|---|
| Marketing/Marketing Management, General | 94 Graduates |
| Finance, General | 67 Graduates |
| Accounting | 38 Graduates |
| Business Administration and Management, General | 27 Graduates |
| Health Professions and Related Programs | 256 Total Graduates / 23% |
| Registered Nursing/Registered Nurse | 218 Graduates |
| Health Professions and Related Clinical Sciences, Other | 36 Graduates |
| Athletic Training/Trainer | 2 Graduates |
| Liberal Arts and Sciences, General Studies and Humanities | 89 Total Graduates / 8% |
| Liberal Arts and Sciences/Liberal Studies | 89 Graduates |
| All Social Science Majors | 67 Total Graduates / 6% |
| Political Science and Government, General | 28 Graduates |
| Political Science and Government, Other | 27 Graduates |
| Economics, Other | 8 Graduates |
| Economics, General | 3 Graduates |
| All Psychology Majors | 54 Total Graduates / 5% |
| Psychology, General | 54 Graduates |
| All Other Diplomas | 33% |
Outcome & Salary
After graduation, you’ll be ready to find a job and begin to earn a salary of your own. Eventually, your years in the university will begin to pay themselves off. Graduate’s early-career salaries average around $48,900 but their mid-career salaries increase to $71,700.
Keep this figure in mind: $129,716. This is the 4-year cost of education, which affects your return on investment (ROI). Graduate’s 10-year salary earnings potential averages $694,570 and their 20-year earnings potential is $1,411,570. Once your 4-year cost of education is subtracted, your 10-year projected ROI is $564,854 and your 20-year projected ROI is $1,281,854.
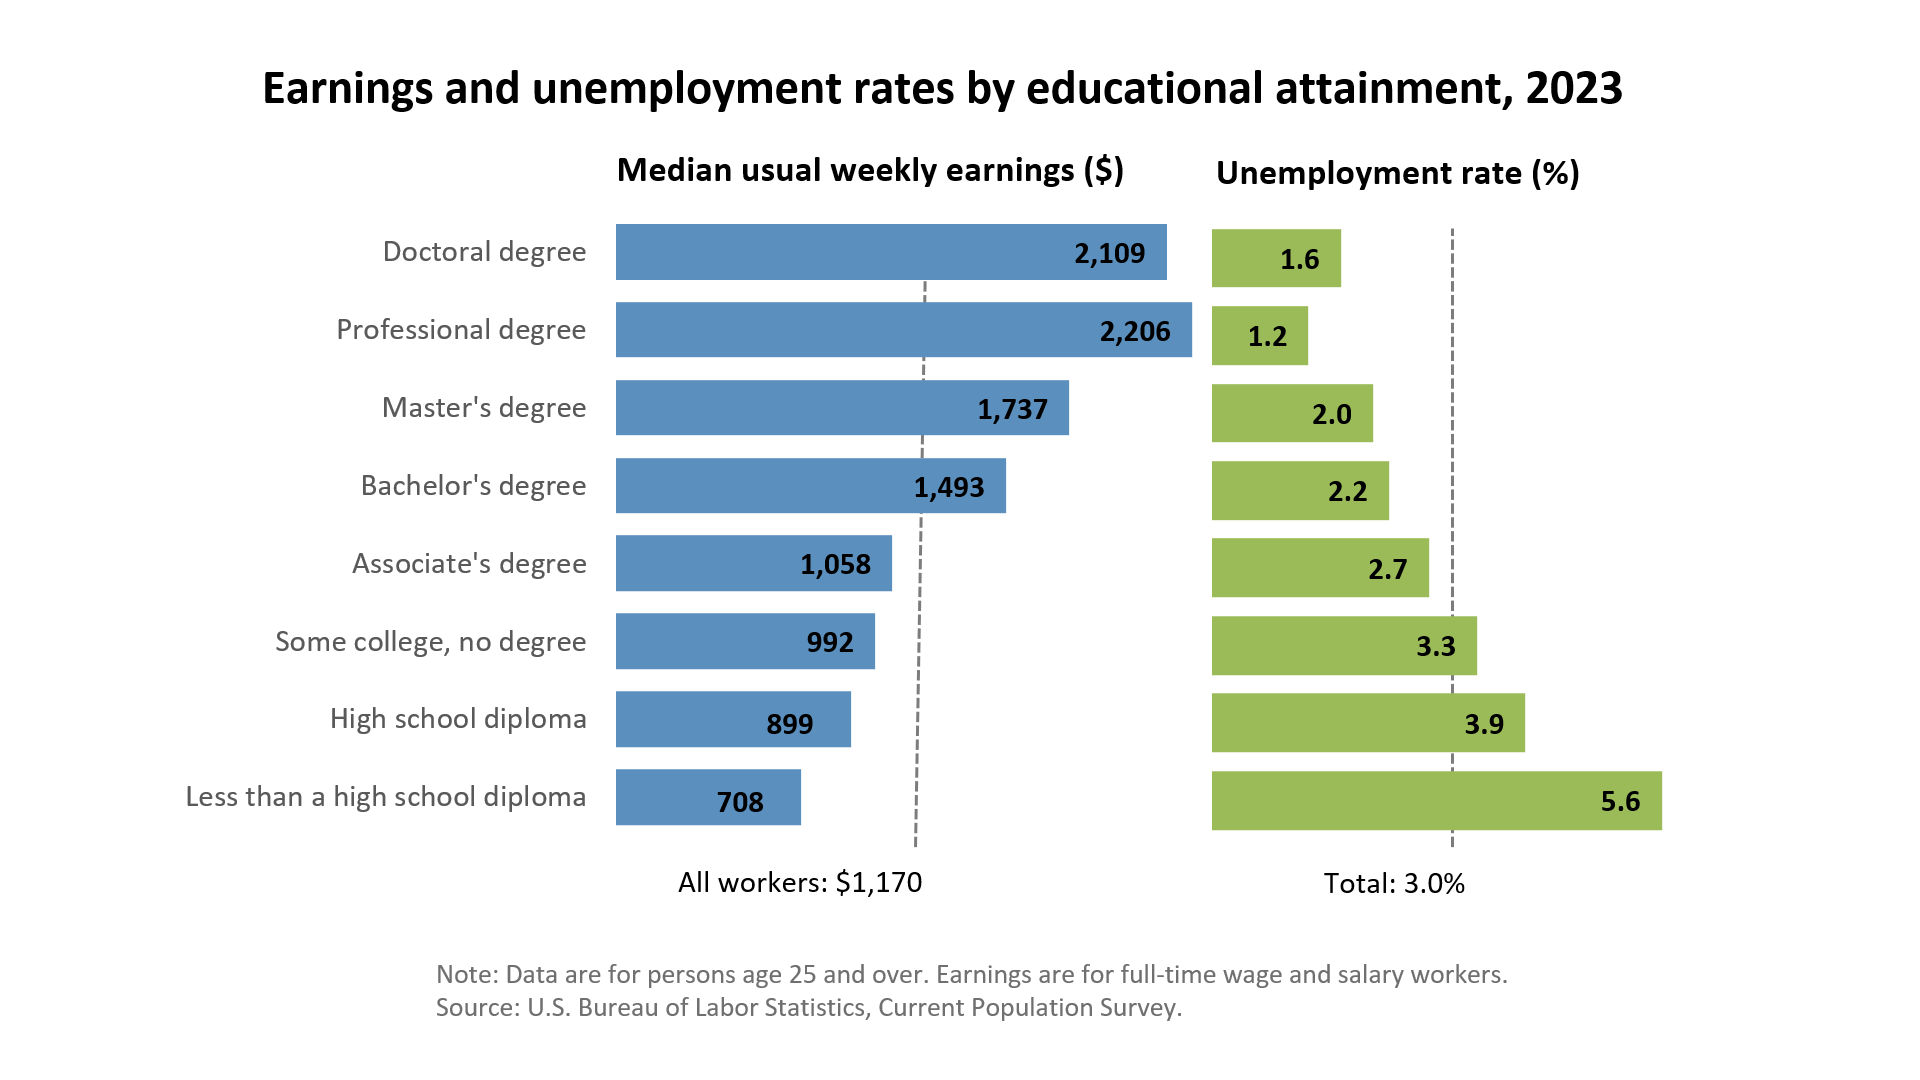
Highschool graduates who don’t go on to college earn a national average salary of $38,792. This makes their 10-year projected income $387,920 and their 20-year projected income $775,840.
| Graduates Salary | |
|---|---|
| College Grads Early Career Salary | $48,900 |
| College Grads Average Salary | $69,457 |
| College Grads Mid Career Salary | $71,700 |
| Return on Investment (ROI) | |
|---|---|
| 10 Year Salary Earnings Potential | $694,570 |
| 20 Year Salary Earnings Potential | $1,411,570 |
| Cost of Education (Net Price) 4 Year | $129,716 |
| 10 Year Projected ROI | $564,854 |
| 20 Year Projected ROI | $1,281,854 |
| No College Education Salary Comparison | |
|---|---|
| National Average Salary | $38,792 |
| 10 Year Projected Income | $387,920 |
| 20 Year Projected Income | $775,840 |
Related Top College Resources


