Get Matched With Online Colleges

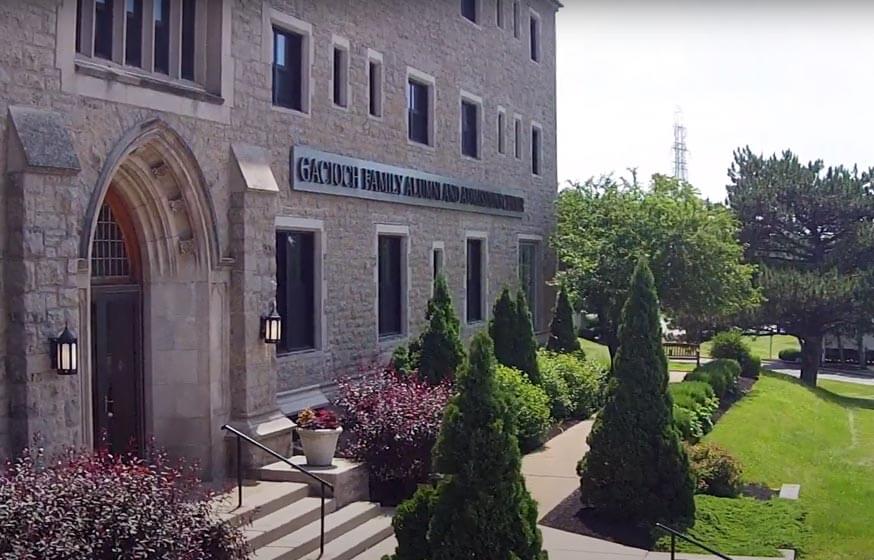
If you attend this school, you can look all around you and take in the beauty that is the Niagara area of New York state. To the north of you, the borders of the United States and Canada meet in the center of Lake Ontario. There’s an interesting feature to the landscape just to the west of Niagara County where Canada loops around to the south shore of Lake Ontario and meets up with the US and Niagara County, which means your school is right by the borders of both countries. You’ll be able to easily take a tour of Niagara Falls and get to a variety of cities in New York state.


Overview of Niagara State University


Returning to the campus, Niagara University is small, with a compact footprint that you’ll be able to walk through easily as you attend your classes. The university is affiliated with the Roman Catholic Church. To the immediate west of the campus, the Niagara Scenic Parkway and Lewiston road send traffic driving by.

You’ll be able to reserve a dorm room and live on campus and this is an ideal way for you, as a freshman, to adjust to a new school and living situation. You’ll be one of nearly 4,000 students who enroll at Niagara University each year.

General Information


School Type Private not-for-profit
Campus Setting Suburb: Large
Campus Housing Yes
Student Faculty Ratio 11:1
Graduation Rate 73%
Year Founded 1856

Student Enrollment


Total Students3,723

Undergraduate
2,808
Graduate
915

Undergraduate Student

Male 1,011
1,011
Female 1,797
1,797

Graduate Student

Male 329
329
Female 586
586

Explore Map

Admissions


APPLICATIONS3,660

Male 1,305
Female 2,355

ACCEPTANCE3,257

Male 1,188
Female 2,072

Acceptance Rate89%

Male 91%
Female 88%

Enrollment 619

Male 232
Female 387
Admissions
Application Fee NA
High School GPA Required
High School Rank Recommended
High School Transcripts Required
College Prep Courses Recommended
Recommendations Recommended
SAT/ACT Considered But Not Required
TOEFL (Test of English as a Foreign Language) Required
Application Deadline August 30
Common Application Accepted Yes

Tuition Cost & Financial Aid


Going to college isn’t cheap, any way you look at it. But, if you look at the eventual return on investment (ROI) that you’re going to gain, you and your parents may be better able to handle the final cost. The total cost combines from tuition, books, supplies, room and board, lab fees, and other various charges. Altogether, that price is around $49,600 for most students.

You and your parents probably won’t need to pay every penny of that. Instead, financial aid may be able to pay for a large portion of your education, and whatever remains is called the average net price. As of a recent academic year, the average net price was $18,462. However, this will change based on your family’s income because that is how eligibility for financial aid is determined. In a recent academic year, families earning between $30,001 and $48,000 paid around $14,145. Families earning between $75,001 and $110,000 paid around $21,864. Other families falling into various income levels paid varying amounts based on the financial aid they were able to receive.

Almost every freshman student qualified for financial aid. As many as 99% received an average of $28,368 in grants and scholarships. The same percentage received about $24,999 in institutional grants and scholarships.

Average net price 2018-2019
Net Price $18,462
Average Total Aid $28,368
Students Receiving Financial Aid 99%
Room & Board $11,700

Sticker Price


  • Tuition In-State - $34,510
  • Tuition Out-of-State - $34,510
  • Books and Supplies - $1,250
  • Room & Board - $11,700
  • Other - $2,200

Academics


During your freshman year, you might end up asking yourself whether you’re going to stay at Niagara University or transfer to another college. If you do decide to stay, you’ll be included in the retention rate, which is the percentage of first-year students who return to the university for their second year of school. Here, the retention rate is 87%, which is excellent and indicates that nearly all students who attend this school think that their classes, teachers, and culture is good enough to warrant coming back for another year.

If you need to take an evening class or even access a class through online learning, your decision to stay might be even easier. If you find that one of your class times conflicts with another class or you are busy with work during one of those classes, rather than drop the class and hope you can pick it up in another semester, you can just pick up another section that offers either evening meeting times or an online option, which are both available for many classes.

The 4-year graduation rate is 66% and the 6-year rate is 73%, which are both at or above the national average. This may be due to the low student-to-faculty ratio of 11 to 1.

The most popular degree programs here are business, management, marketing and related support services; education and social sciences; health professions and related programs; and biological and biomedical sciences.

Student Population Total


Student Population 3,723

Undergraduate
2,808
Graduate
915
Evening Classes : Yes
Online Learning : Yes

Most Popular Programs & Majors

(# of Diplomas Awarded by Subject)


All Business Majors 228 Total Graduates / 28%
Business Administration and Management, General 68 Graduates
Accounting 49 Graduates
Hotel, Motel, and Restaurant Management 28 Graduates
Marketing/Marketing Management, General 27 Graduates
All Education Majors 200 Total Graduates / 25%
Education, General 135 Graduates
Elementary Education and Teaching 21 Graduates
Education/Teaching of Individuals in Elementary Special Education Programsy 16 Graduates
English/Language Arts Teacher Education 9 Graduates
All Social Sciences Majors 84 Total Graduates / 10%
Criminology 56 Graduates
Political Science and Government, General 13 Graduates
Sociology 8 Graduates
International Relations and Affairs 7 Graduates
Health Professions and Related Programs 67 Total Graduates / 8%
Registered Nursing/Registered Nurse 67 Graduates
All Biological & Biomedical Majors 41 Total Graduates / 5%
Biology/Biological Sciences, General 37 Graduates
Biochemistry 3 Graduates
Biological and Biomedical Sciences, Other 1 Graduates
All Other Diplomas 24%

Outcome & Salary


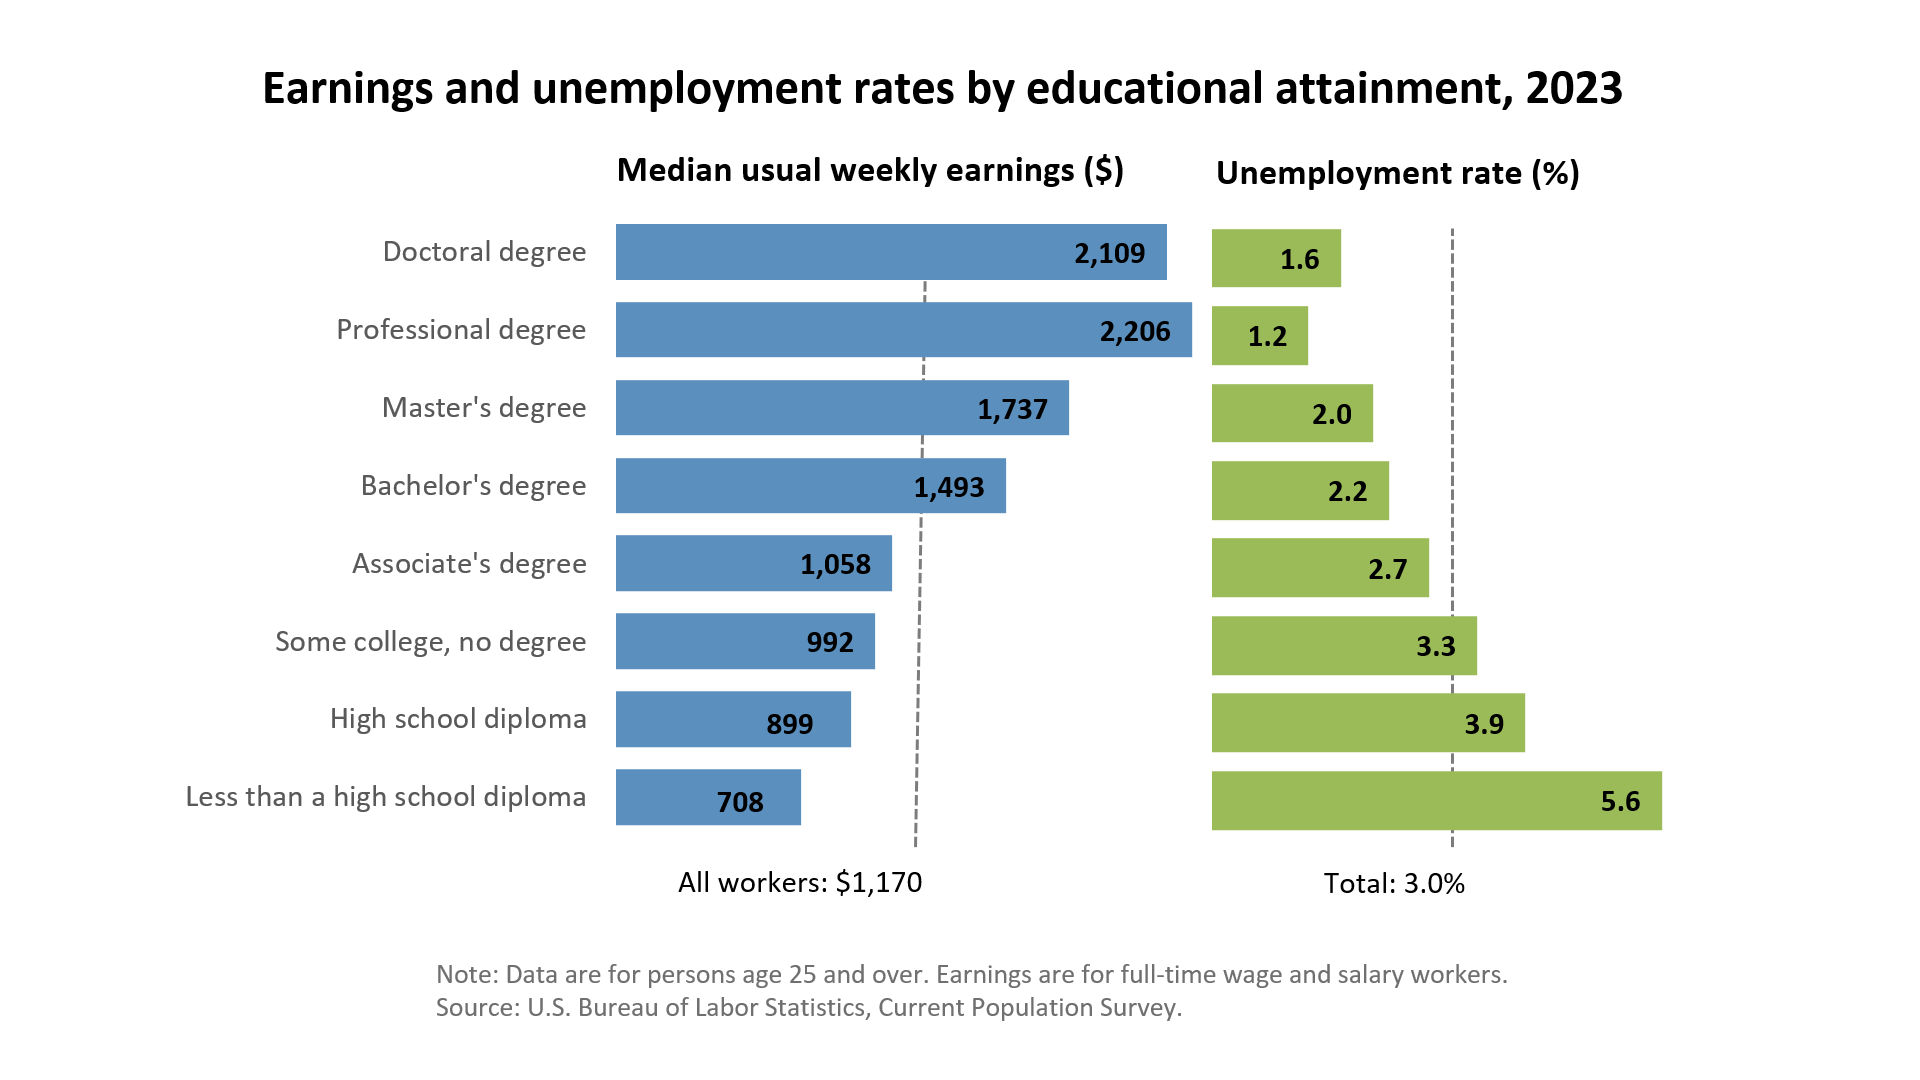
Once you take your walk across the stage at your commencement, you’ll be walking right into a new career. A graduate’s early-career salary averages around $45,100 and their mid-career salaries are closer to $86,300.

Remember this dollar figure: $73,848. This is the 4-year cost of education, which affects your return on investment (ROI). Your 10-year salary earnings potential as a graduate will be $589,260 and your 20-year salary potential will be $1,452,260. Once you subtract your cost of education, your 10-year projected ROI is $515,412 and your 20-year projected ROI is $1,378,412.

This compares to the national average salary of a high school graduate, which is $38,792. Their 10-year projected income is $387,920 and their 20-year projection is $775,840.

Graduates Salary
College Grads Early Career Salary $45,100
College Grads Average Salary $58,926
College Grads Mid Career Salary $86,300
Return on Investment (ROI)
10 Year Salary Earnings Potential $589,260
20 Year Salary Earnings Potential $1,452,260
Cost of Education (Net Price) 4 Year $73,848
10 Year Projected ROI $515,412
20 Year Projected ROI $1,378,412
No College Education Salary Comparison
National Average Salary $38,792
10 Year Projected Income $387,920
20 Year Projected Income $775,840

Photos & Videos


Search All Programs