Get Matched With Online Colleges
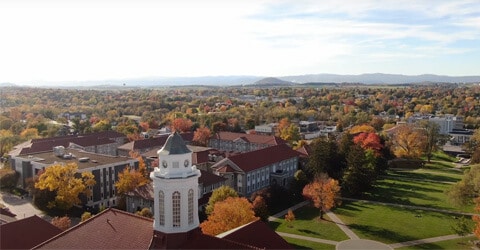
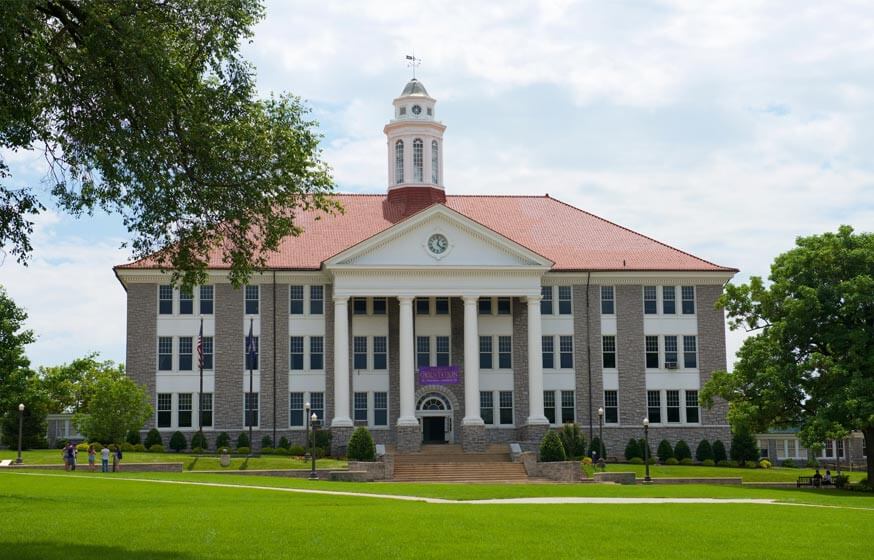
Named for the founding father and fourth president, this public research university in the Shenandoah Valley in Harrisonburg, Virginia has approximately 20,000 undergraduate students and 1,900 graduate students. JMU features 130+ degree programs, and 1,575 instructors. This diverse university includes 22% minority enrollment. In-state students make up roughly 77% of the student body, with out-of-state students making up the other 23%. Many international students attend JMU.
Search All Programs
Overview of James Madison University
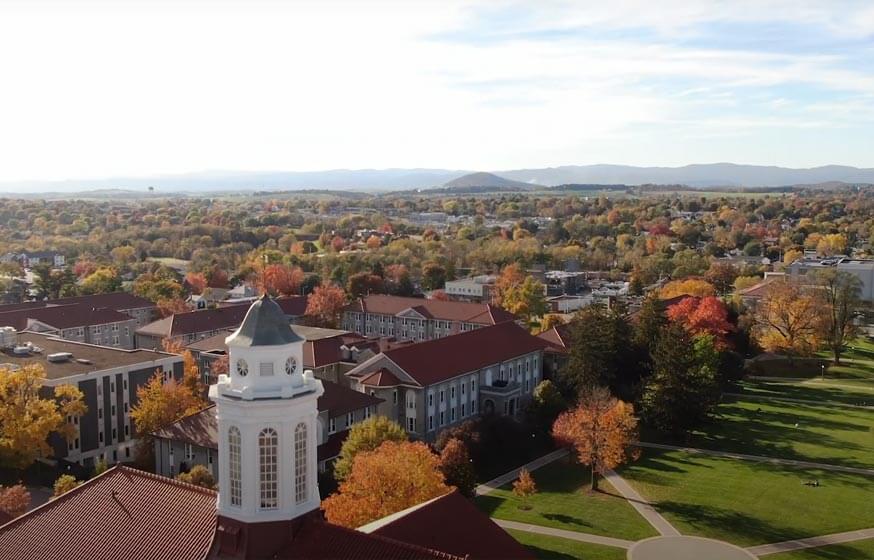
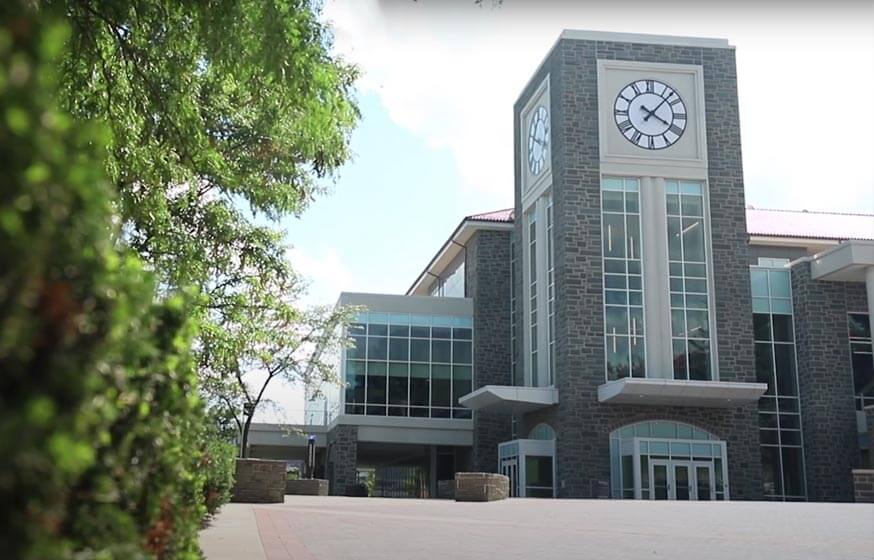
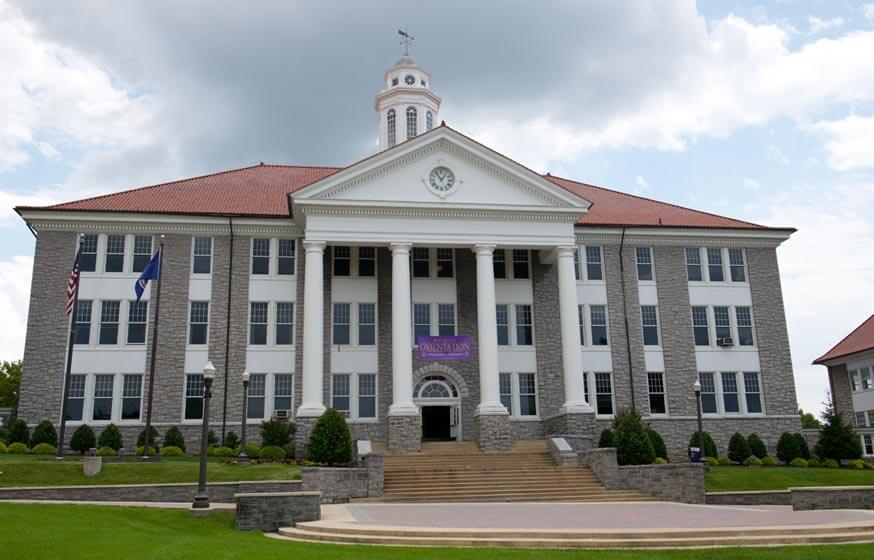
The 721-acre campus features 148 major buildings. JMU’s facilities offer cutting-edge research, study abroad programs, and distance and online learning options. JMU’s seven colleges consist of the College of Arts and Letters, the College of Business, the College of Education, the College of Health and Behavioral Studies, the College of Integrated Science and Engineering, the College of Science and Mathematics, the College of Visual and Performing Arts, and a Graduate School. Graduate degree programs include art and music; business; communications, humanities, and social sciences; education; health and behavioral studies; and science, technology, engineering, and math. It also offers professional and continuing education for various licensure and other requirements.
As of Fall 2019, 77 percent of applicants were accepted by JMU.
General Information
| School Type | Public |
|---|---|
| Campus Setting | City: Small |
| Campus Housing | Yes |
| Student Faculty Ratio | 16:1 |
| Graduation Rate | 84% |
| Year Founded | 1908 |
Student Enrollment
Total Students21,751
19,923
1,828
Undergraduate Student
Male 8,368
Female 11,555
Graduate Student
Male 768
Female 1,060
Explore Map
Top Rankings For James Madison University
JMU Acceptance Rate and Admissions
APPLICATIONS23,579
ACCEPTANCE18,156
Acceptance Rate77%
Enrollment 4,539
| Admissions | |
|---|---|
| Application Fee | $70 |
| High School GPA | Required |
| High School Rank | NA |
| High School Transcripts | Required |
| College Prep Courses | Required |
| Recommendations | Recommended |
| SAT/ACT | Considered But Not Required |
| TOEFL (Test of English as a Foreign Language) | Required |
| Application Deadline | January 15 |
| Common Application Accepted | No |
JMU Tuition Cost & Financial Aid
For a recent academic year, tuition at JMU was $12,206 for in-state students and $29,106 for out-of-state residents. On-campus room and board cost $10,938. Total expenses for in-state students paying room and board was $28,182 and $45,082 for out-of-state residents.
In the same year, 62% of undergraduates received some form of financial aid. The average amount of grant or scholarship aid received was $7,507, while the average Pell Grant was $4,455 and the average amount of federal student loan aid was $6,210. The average net price (the cost students were still responsible for after financial aid had been applied) was around $18,708. However, if your family is on the lower end of the spectrum of annual income, say $48,000 or below, you can expect to pay less than those who make more or significantly more annually. This is because financial aid is awarded first to those who have need, those who make less. So, those with more need will have a lower average net price after their financial aid has been applied.
| Average net price | 2018-2019 |
|---|---|
| Net Price | $18,708 |
| Average Total Aid | $8,413 |
| Students Receiving Financial Aid | 62% |
| Room & Board | $10,938 |
Sticker Price
- Tuition In-State - $12,206
- Tuition Out-of-State - $29,106
- Books and Supplies - $1,056
- Room & Board - $10,938
- Other - $3,982
Academics
When considering colleges or universities, you can look at particular metrics to help you make your decision. Retention rates are a critical indicator, as they reveal the number of first-time students returning to the institution the next year. Low retention rates can definitely be a negative factor. A good student-to-faculty ratio means students have more opportunity to interact with professors. The graduation rate measures the percentage of first-time students completing their degrees within 150% of the standard program time, generally six years. Low graduation rates are often indicative of issues with the school.
JMU’s student-to-faculty ratio is 16 to 1, which is somewhat high but still within the range that you shouldn’t have trouble setting up office time with your professors, you just might not be able to stop them after class to ask questions. The school’s retention rate for first-time students pursuing a bachelor’s degree is solid at 89% of full-time students and a whopping 100% of part-time students. The overall graduation rate is well above the national average at 84%.
Retention
Rate
4 year
Graduation
Rate
6 year
Graduation
Rate
Student Population Total
Student Population 21,751
19,923
1,828
Most Popular Programs & Majors
(# of Diplomas Awarded by Subject)
| Health Professions and Related Programs | 878 Total Graduates / 20% |
|---|---|
| Community Health Services/Liaison/Counseling | 467 Graduates |
| Registered Nursing/Registered Nurse | 228 Graduates |
| Health/Health Care Administration/Management | 91 Graduates |
| Speech-Language Pathology/Pathologist | 73 Graduates |
| All Business Majors | 738 Total Graduates / 16% |
| Marketing/Marketing Management, General | 166 Graduates |
| Finance, General | 150 Graduates |
| Business Administration and Management, General | 142 Graduates |
| Hospitality Administration/Management, General | 120 Graduates |
| Communication, Journalism, and Related Program | 394 Total Graduates / 9% |
| Speech Communication and Rhetoric | 394 Graduates |
| All Social Sciences Majors | 377 Total Graduates / 8% |
| International Relations and Affairs | 99 Graduates |
| Political Science and Government, General | 78 Graduates |
| Economics, General | 70 Graduates |
| Geography | 65 Graduates |
| Parks, Recreation, Leisure, and Fitness Studies | 239 Total Graduates / 5% |
| Sport and Fitness Administration/Management | 126 Graduates |
| Health and Physical Education/Fitness, General | 113 Graduates |
| All Other Diplomas | 42% |
Outcome & Salary
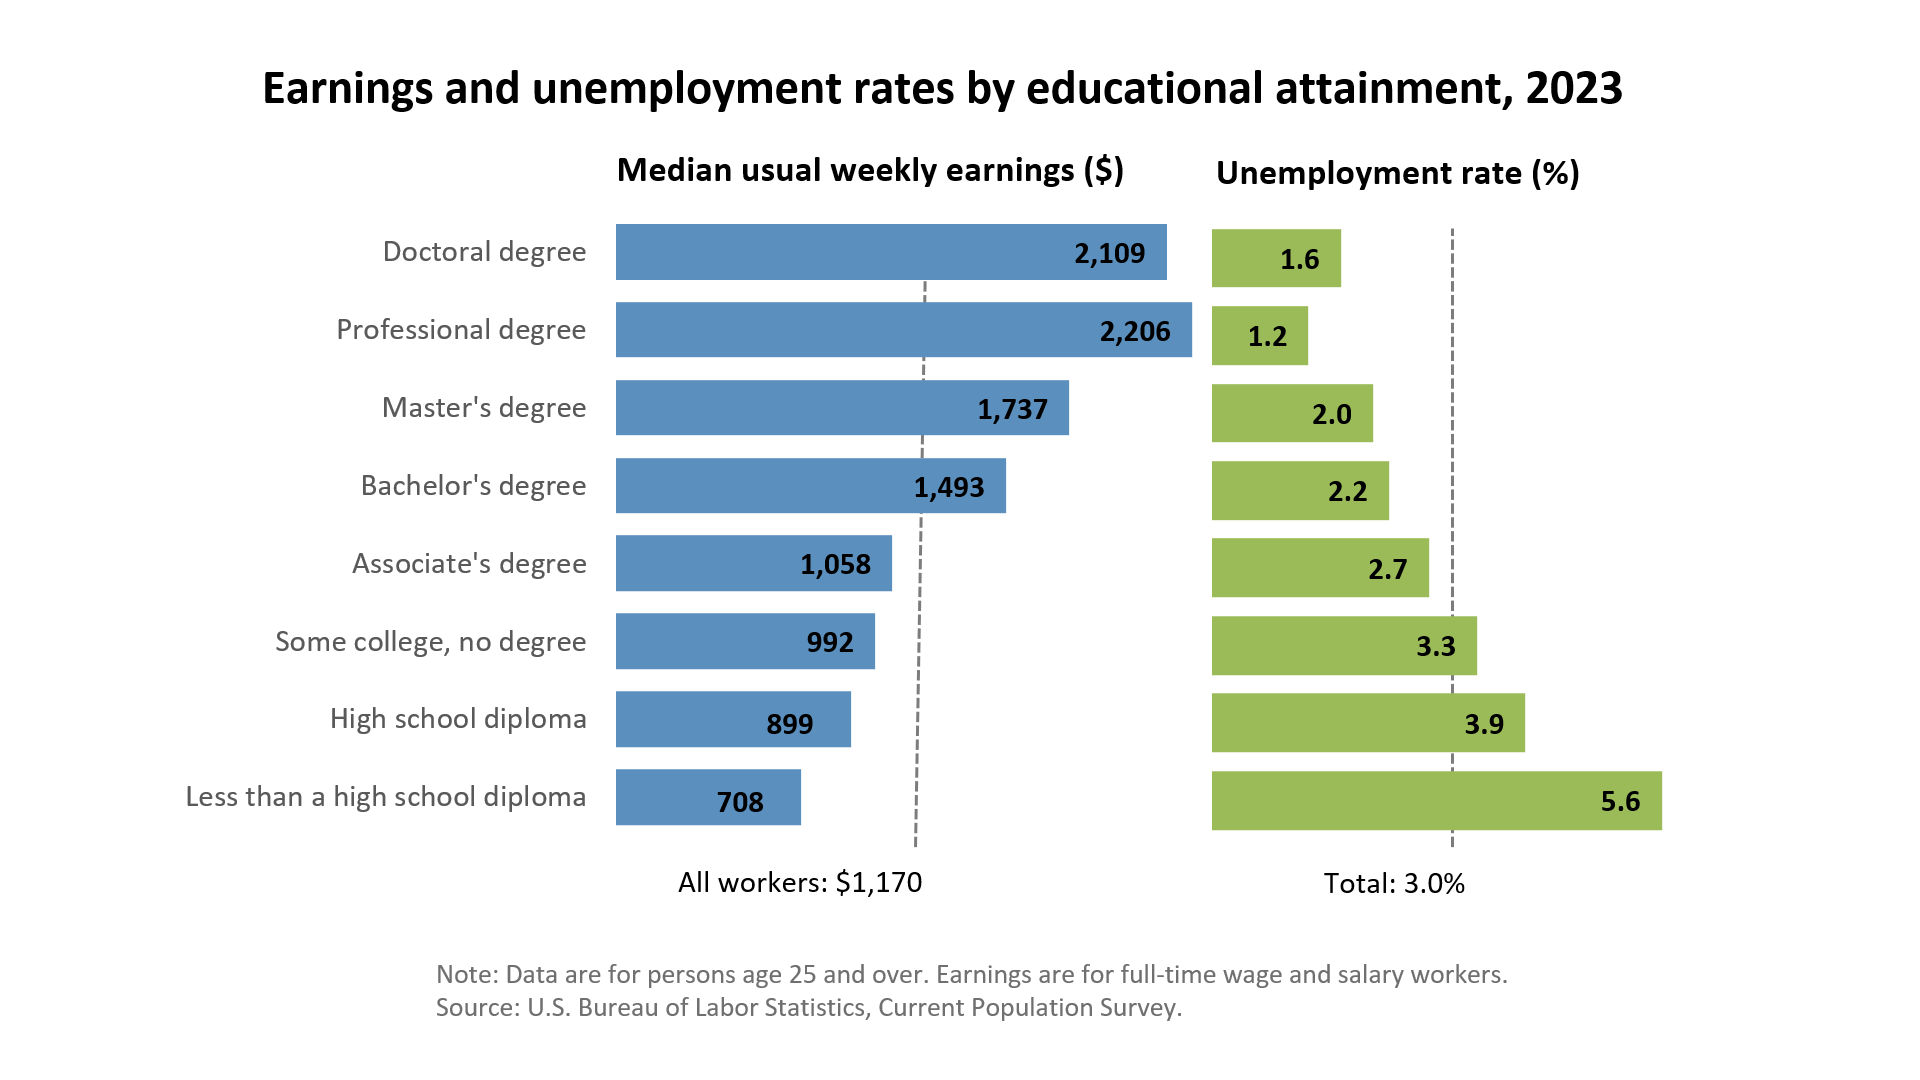
College graduates will earn considerably more than non-college graduates over their careers. Graduates can expect to earn around $58,000 annually in their early career and as their pay increases, around the middle of their career, their salary will average around $108,000.
For the average net education price of $74,000, the ROI for 10 years of salary earnings potential is $656,170, while the ROI for 20 years of salary earnings potential is $1,745,170. That makes their 10-year projected income $581,338 and their 20-year projected income $1,670,338.
Compare that to the national average salary of $38,792 for someone without a college education. Their 10-year projected income is $387,920 and their 20-year projected income is $775,840.
| Graduates Salary | |
|---|---|
| College Grads Early Career Salary | $58,000 |
| College Grads Average Salary | $65,617 |
| College Grads Mid Career Salary | $108,900 |
| Return on Investment (ROI) | |
|---|---|
| 10 Year Salary Earnings Potential | $656,170 |
| 20 Year Salary Earnings Potential | $1,745,170 |
| Cost of Education (Net Price) 4 Year | $74,832 |
| 10 Year Projected ROI | $581,338 |
| 20 Year Projected ROI | $1,670,338 |
| No College Education Salary Comparison | |
|---|---|
| National Average Salary | $38,792 |
| 10 Year Projected Income | $387,920 |
| 20 Year Projected Income | $775,840 |
Related Top College Resources
Search All Programs

