University Headquarters (HQ) is an industry-leading, independent educational organization that provides independent college rankings using a proprietary formula to create first class unbiased rankings. The team at University HQ strives to provide accurate and trustworthy rankings that highlights the best programs.
Get Matched With Online Colleges
After more than 150 years as a premier educational institution, LeHigh University continues to graduate some of the top professionals in the nation. This is due to a favorable 9-to-1 student/faculty ratio, an active student body, and a high percentage of students with international experience including internships and research. On top of impressive academic statistics, LeHigh also boasts competitive NCAA, Division 1 athletic programs for men and women. Athletic opportunities include lacrosse, basketball, soccer, tennis, rowing, and more. If you're not yet ready for the varsity squad, LeHigh can engage you with a wide range of intramural sports, campus clubs, and loads of other activities. Ninety-three percent of Lehigh students participate in extra-curricular activities.
Search All Programs
Overview of Lehigh University (LU)
In the classroom, students find that the student-faculty ratio enables professors to take more of a personal interest in their education. At LeHigh, it's not uncommon for students to work with professor-mentors on research projects and receive other academic guidance. Students also participate in internships at a fantastic rate. Since Lehigh is close to Philadelphia and New York City, not to mention copious opportunities in the Lehigh valley, you're sure to find the right company to learn from.
General Information
| School Type | Private not-for-profit |
|---|---|
| Campus Setting | City: Small |
| Campus Housing | Yes |
| Student Faculty Ratio | 9:1 |
| Graduation Rate | 87% |
| Year Founded | 1865 |

Student Enrollment
Total Students6,849
5,047
1,802
Undergraduate Student
Male 2,725
Female 2,322
Graduate Student
Male 973
Female 829
Explore Map
Top Rankings For Lehigh University
LU Acceptance Rate and Admissions
APPLICATION15,622
ACCEPTANCE3,437
Acceptance Rate22%
Enrollment 5,780
| Admissions | |
|---|---|
| Application Fee | $70 |
| High School GPA | Recommended |
| High School Rank | - |
| High School Transcripts | Required |
| College Prep Program | Recommended |
| Recommendations | Recommended |
| SAT/ACT | Required |
| TOEFL (Test of English as a Foreign Language) | Recommended |
| Application Deadline | January 1 |
| Common Application Accepted | Yes |
LU Tuition Cost & Financial Aid
Lehigh's per-year costs are somewhat high at over $55,000 per year. Total yearly costs including room and board run up to approximately $68,595. to help defray some costs, over 2,500 students receive aid in the form of grants or scholarships that needn't be repaid. The total amount these students receive is over $98,000 and averages out to $38,000 per student. 1,966 Lehigh students also take out student loans totaling $11,742,502 or $5,900 per student.
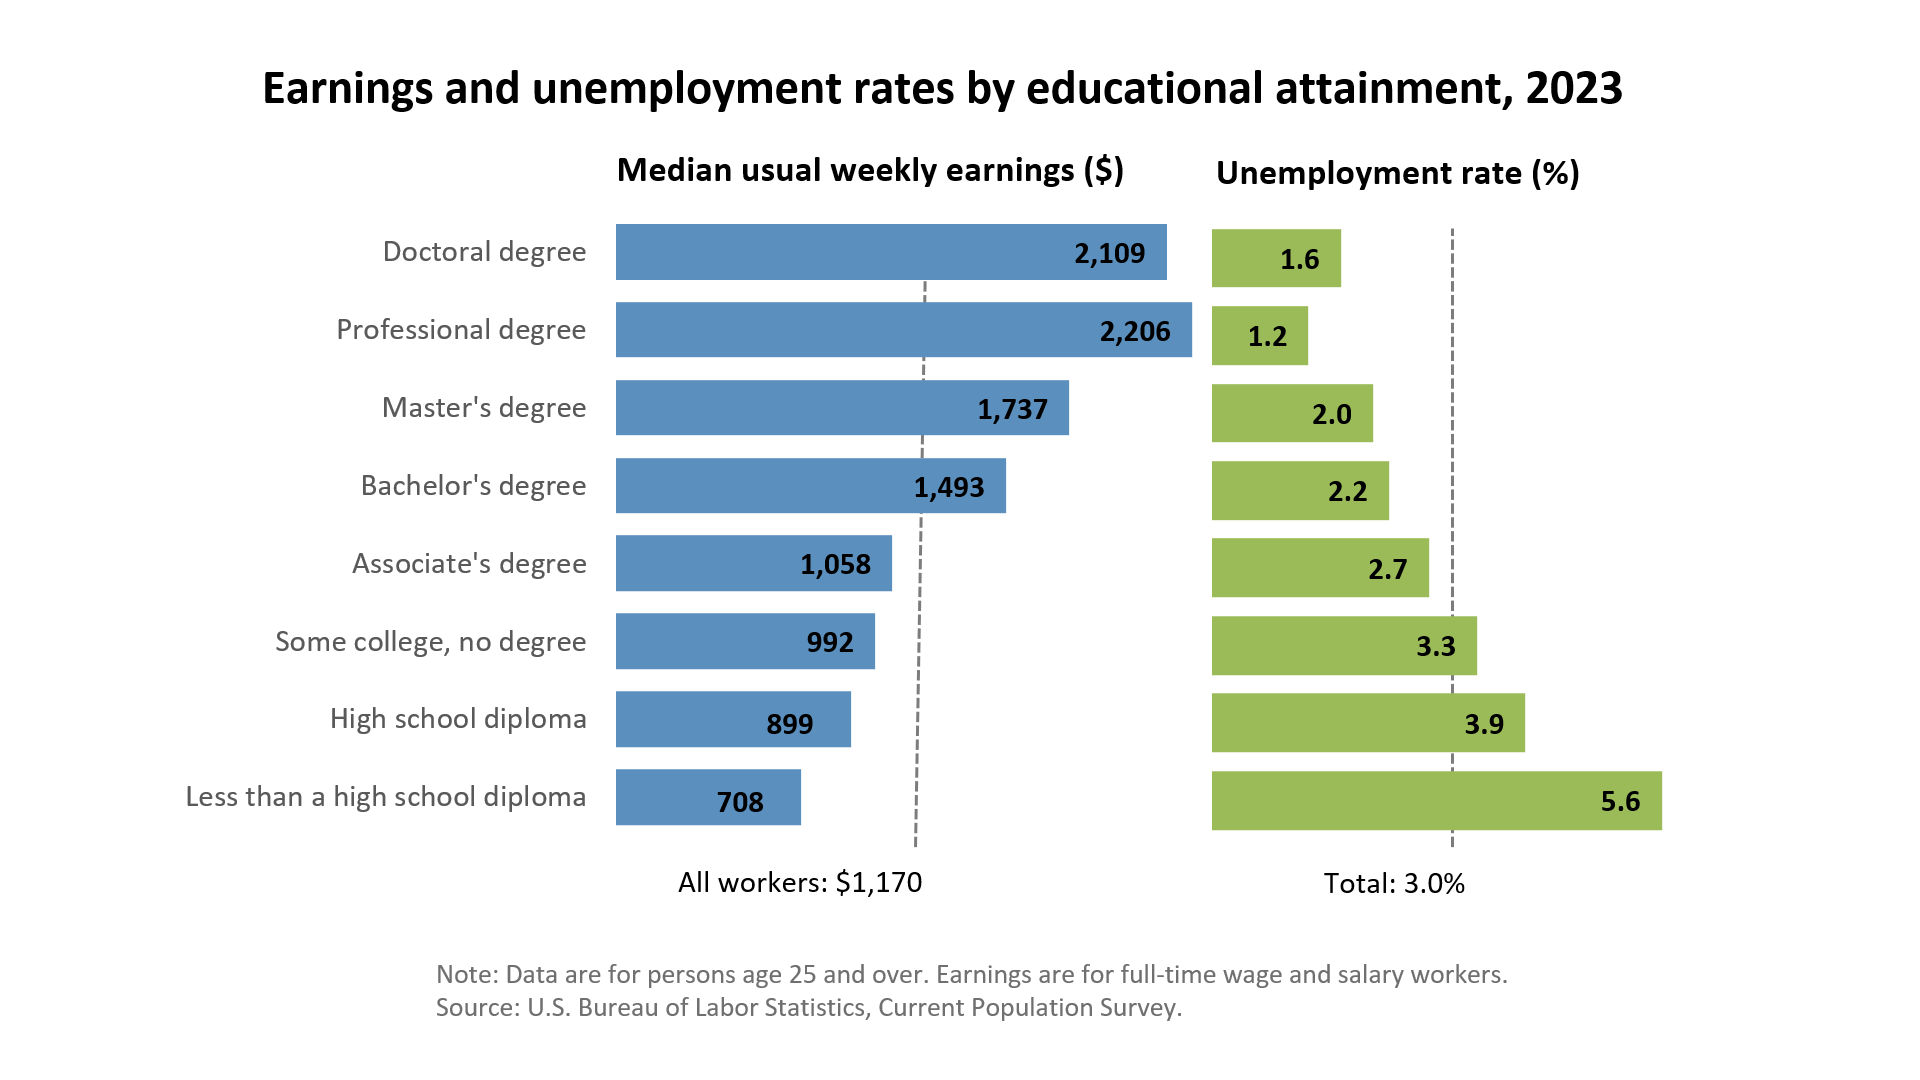
Payscale.com's research indicates that Lehigh students amass a 20-year net return of $679,000, or 6.9% per year. In fact, Lehigh alumni average $82,000/year and the average starting, or early career, salary is $69,500. Considering the high academic standards at Lehigh, most students should be able to attend graduate school and push their earnings even higher.
| Average net price | 2017-2018 |
|---|---|
| Net Price | $26,782 |
| Average Total Aid | $38,909 |
| Students Receiving Financial Aid | 70% |
| Room & Board | $13,600 |
Sticker Price
- Tuition In-State - $52,930
- Tuition Out-of-State - $52,930
- Books and Supplies - $1,000
- Room & Board - $13,600
- Other - $1,065
Academics
Lehigh is a competitive institution that accepts 32% of applicants. Studies have shown that more competitive institutions retain students at a higher rate. This is true for Lehigh, which graduates 77% of all incoming first-year students within four years and 89% within six years. The overall graduation rate for students graduating anywhere between four and eight years is 87%. The school also retains 94% of its first-year students into their second year.
These numbers indicate that students at Lehigh are satisfied with the education they're receiving. Moreover, they are likely having fun and are comfortable among their peers on campus. This could be due to many factors, but the 9-to-1 student/faculty ratio is surely a large factor. At Lehigh, that number is further bolstered by a faculty dedicated to educating their students and engaging them in research projects. When students feel seen and heard in class, they are more likely to be engaged and excited about learning. This translates both into high graduation rates and success in the professional world.
Retention
Rate
4 year
Graduation
Rate
6 year
Graduation
Rate
Student Population Total
Student Population 6,849
5,047
1,802
Most Popular Programs & Majors
(# of Diplomas Awarded by Subject)
| All Business Majors | 363 Total Graduates / 30% |
|---|---|
| Accounting | 59 Graduates |
| Finance, General | 183 Graduates |
| Marketing/Management, General | 50 Graduates |
| All Engineering Majors | 363 Total Graduates / 30% |
| Aerospace | - |
| Chemical | 44 Graduates |
| Mechanical | 111 Graduates |
| All Social Science Majors | 58 Total Graduates / 5% |
| Economics, General | - |
| Political Science and Government | 23 Graduates |
| Sociology | 6 Graduates |
| Anthropology | 3 Graduates |
| All Biological & Biomedical Majors | 82 Total Graduates / 7% |
| Exercise Physiology | - |
| Biology/Biological Sciences | 46 Graduates |
| Medical Microbiology and Bacteriology | - |
| All Computer Information Science Majors | 23 Total Graduates / 1% |
| All Other Diplomas | 27% |
Outcome & Salary
Lehigh graduates can have high expectations for their post-college lives. In fact, 95% of a recent class found gainful employment or entered a graduate program within 6 months of graduation. Five percent were found to be still seeking work and 2% were listed as other, perhaps traveling or pursuing some individual project.
When graduates land their first jobs, they start with an average salary of $65,000 before any bonuses or benefits are calculated. It should be noted that new graduates are not alone as the alumni network numbers 85,000. This alumni network may, in part, account for the high volume of students who complete an experiential learning opportunity. Eighty-nine percent of students become involved in internships and other off-campus learning opportunities during their undergraduate years.
| Graduates Salary | |
|---|---|
| College Grads Early Career Salary | $69,500 |
| College Grads Average Salary | $82,000 |
| College Grads Mid Career Salary | $134,100 |
| Return on Investment (ROI) | |
|---|---|
| 10 Year Salary Earnings Potential | $820,000 |
| 20 Year Salary Earnings Potential | $2,161,000 |
| Cost of Education (Net Price) 4 Year | $107,128 |
| 10 Year Projected ROI | $712,872 |
| 20 Year Projected ROI | $2,063,872 |
| No College Education Salary Comparison | |
|---|---|
| National Average Salary | $38,792 |
| 10 Year Projected Income | $387,920 |
| 20 Year Projected Income | $775,840 |
Related Top College Resources


