Get Matched With Online Colleges
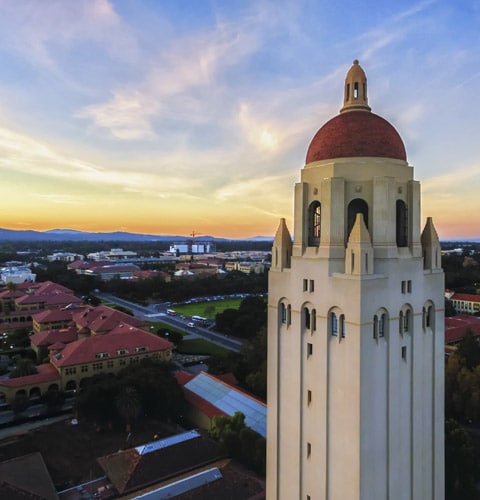
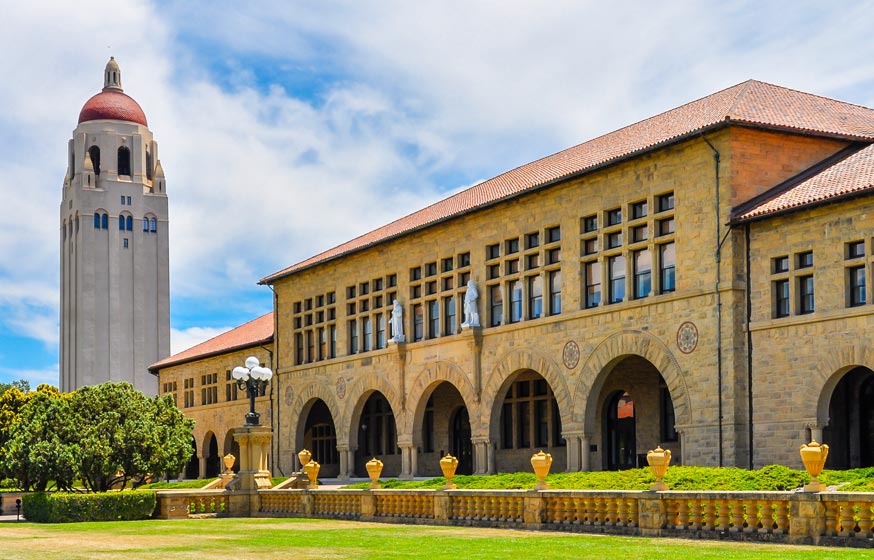
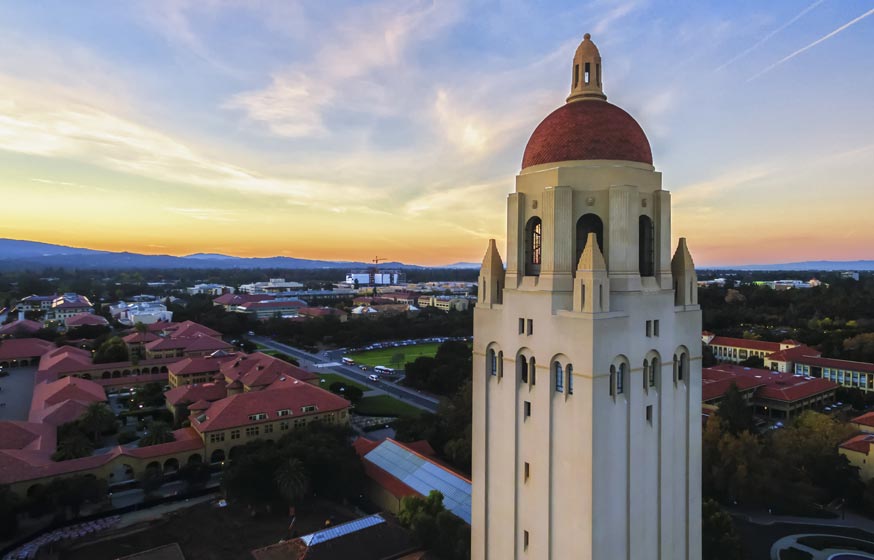
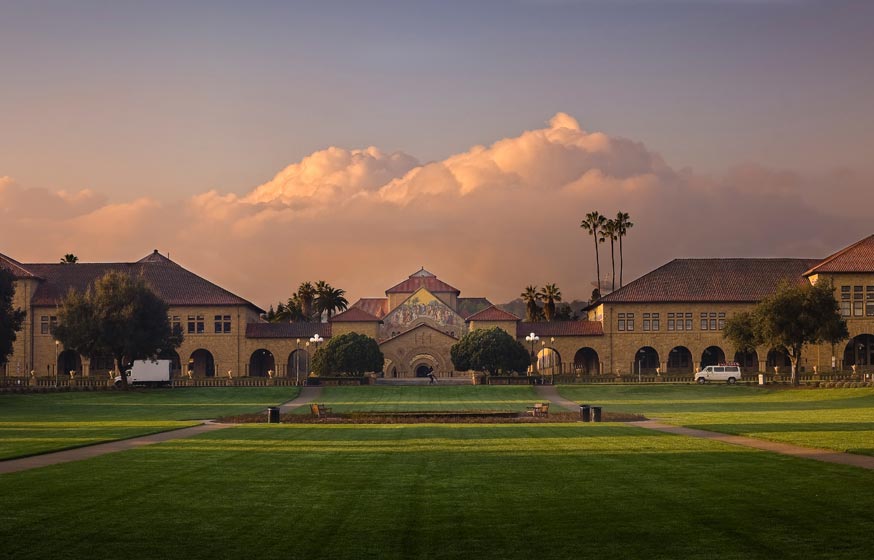
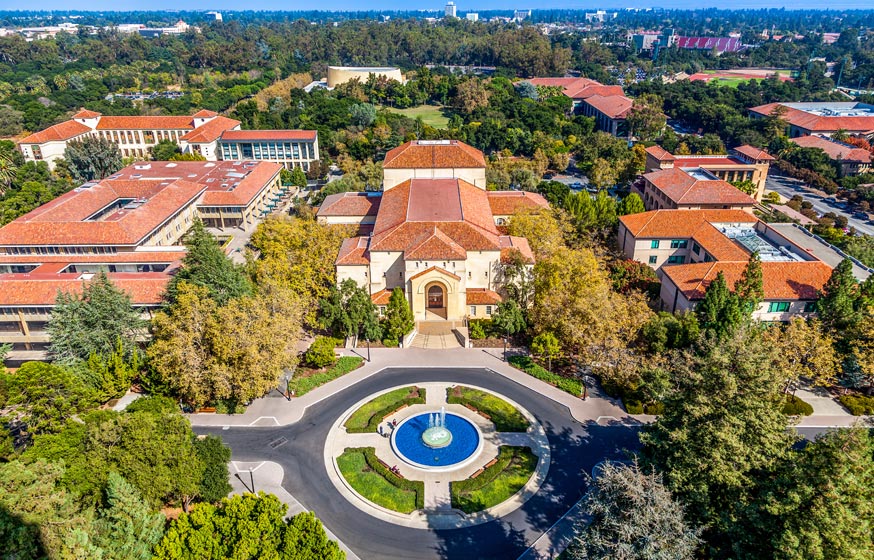
Stanford University, located in a large California suburb, is a private, not-for-profit university. The university was founded in 1885. Located in a picturesque community, Stanford University houses almost 17,500 students, ranging from undergraduate to graduate. Campus housing (dorms and student apartments) are available for students to live in.
Search All Programs
Overview of Stanford University (SU)
On-campus, students can go from one building to the next, sheltered by abundant greenery. If they want to study outdoors, there are plenty of areas to settle with backpacks, books, and highlighters. And, when they have time away from their studies and classes, they can venture off-campus to get to know the community of Stanford. From shopping to parks, all students should be able to find an activity that interests them.
Students and faculty are well-balanced; the student-to-faculty ratio is 5 to 1, giving students and professors/instructors ample opportunity to meet if students are having a hard time understanding class materials.
Currently, 7,000+ students are in the undergraduate class, with the remaining 10,000+ in the graduate class. The split between male and female students is balanced at 50-50.
General Information
| School Type | Private not-for-profit |
|---|---|
| Campus Setting | Suburb: Large |
| Campus Housing | Yes |
| Student Faculty Ratio | 5 to 1 |
| Graduation Rate | 94% |
| Year Founded | 1885 |

Student Enrollment
Total Students17,381
7,087
10,294
Undergraduate Student
Male 3,543.5
Female 3,543.5
Graduate Student
Male 5,147
Female 5,147
Explore Map
Top Rankings For Stanford University
SU Acceptance Rate and Admissions
APPLICATION47,452
ACCEPTANCE1,898
Acceptance Rate4%
Enrollment 1,556
| Admissions | |
|---|---|
| Application Fee | $90 |
| High School GPA | Recommended |
| High School Rank | N/A |
| High School Transcripts | Required |
| College Prep Courses | Recommended |
| Recommendations | Required |
| SAT/ACT | Required |
| TOEFL (Test of English as a Foreign Language) | Recommended |
| Application Deadline | April 15 |
| Common Application Accepted | Yes |
SU Tuition Cost & Financial Aid
Even with financial aid, attending Stanford University is expensive. The average net price, which is derived after financial aid has been used to bring down the semester’s tuition, is $17,271. This cost also includes fees charged by the university.
The actual cost of a year’s worth of tuition and fees is $53,529, though the lower a family’s income, the more likely they will be able to receive financial assistance.
Students and families do have access to financial aid. An average of 1,156 students (68%) of freshmen receive student aid. Fifty-four percent of incoming students (910) receive grants and/or scholarships. The same number and percentage of students receive institutional grants and scholarships (aid that is generated by the university).
| Average net price | 2017-2018 |
|---|---|
| Net Price | $17,271 |
| Average Total Aid | $51,838 |
| Students Receiving Financial Aid | 68% |
| Room & Board | $16,433 |
Sticker Price
- Tuition In-State - $53,529
- Tuition Out-of-State - $53,529
- Books and Supplies - $1,245
- Room & Board - $16,433
- Other - $3,363
Academics
Students at Stanford have a retention rate of 99%. This is the amount of first-time students who continue to attend Stanford after their freshman year. Undergraduate students have a 75% graduation rate at the four-year mark. Students who stay in school beyond the four-year mark have a 94% graduation rate at the six-year point.
Nontraditional students won’t find evening classes that accommodate their work schedules. Instead, they can enroll in distance learning (online classes) so they can begin their college classes and earn a degree.
Students are able to enroll in one of several majors, ranging from business, science, technology, engineering, and math (STEM), to communications/journalism, social sciences, biology, and biomedical fields. Students drawn to computer and information sciences will also find programs that allow them to convert that interest into lucrative careers.
Additional majors include ethnic, cultural, gender, and group studies (African Studies, Latin American studies, and more). English and foreign language majors allow students to delve into other cultures. Health professions, law, liberal arts, natural resources, public administration, psychology, and visual and performing arts are also majors students can select. All these majors allow students to create the lives and careers they want.
Retention
Rate
4 year
Graduation
Rate
6 year
Graduation
Rate
Student Population Total
Student Population 17,381
7,087
10,294
Most Popular Programs & Majors
(# of Diplomas Awarded by Subject)
| All Engineering Majors | 356 Total Graduates / 20% |
|---|---|
| Engineering, Other | 120 Graduates |
| Mechanical Engineering | 79 Graduates |
| Electrical and Electronics Engineering | 62 Graduates |
| Bioengineering and Biomedical Engineering | 38 Graduates |
| Chemical Engineering | 25 Graduates |
| All Computer Information Science Majors | 327 Total Graduates / 18% |
| Computer Science | 327 Graduates |
| Multi/Interdisciplinary Studies | 270 Total Graduates / 15% |
| Human Biology | 125 Graduates |
| Cognitive Science | 78 Graduates |
| Science, Technology and Society | 67 Graduates |
| All Social Science Majors | 224 Total Graduates / 12% |
| Econometrics and Quantitative Economics | 86 Graduates |
| Political Science and Government, General | 52 Graduates |
| International Relations and Affairs | 50 Graduates |
| Anthropology | 13 Graduates |
| Sociology | 13 Graduates |
| Engineering Technology & Engineering-Related Fields | 93 Total Graduates / 5% |
| Engineering/Industrial Management | 93 Graduates |
| All Other Diplomas | 30% |
Outcome & Salary
Students who graduate from Stanford University earn good livings. The early-career salaries for graduates are $83,500; the average salary is $106,000; and mid-career salary is $161,400. The return on investment (ROI) for a 10-year potential salary is $1,060,000; and the 20-year ROI is $2,674,000.
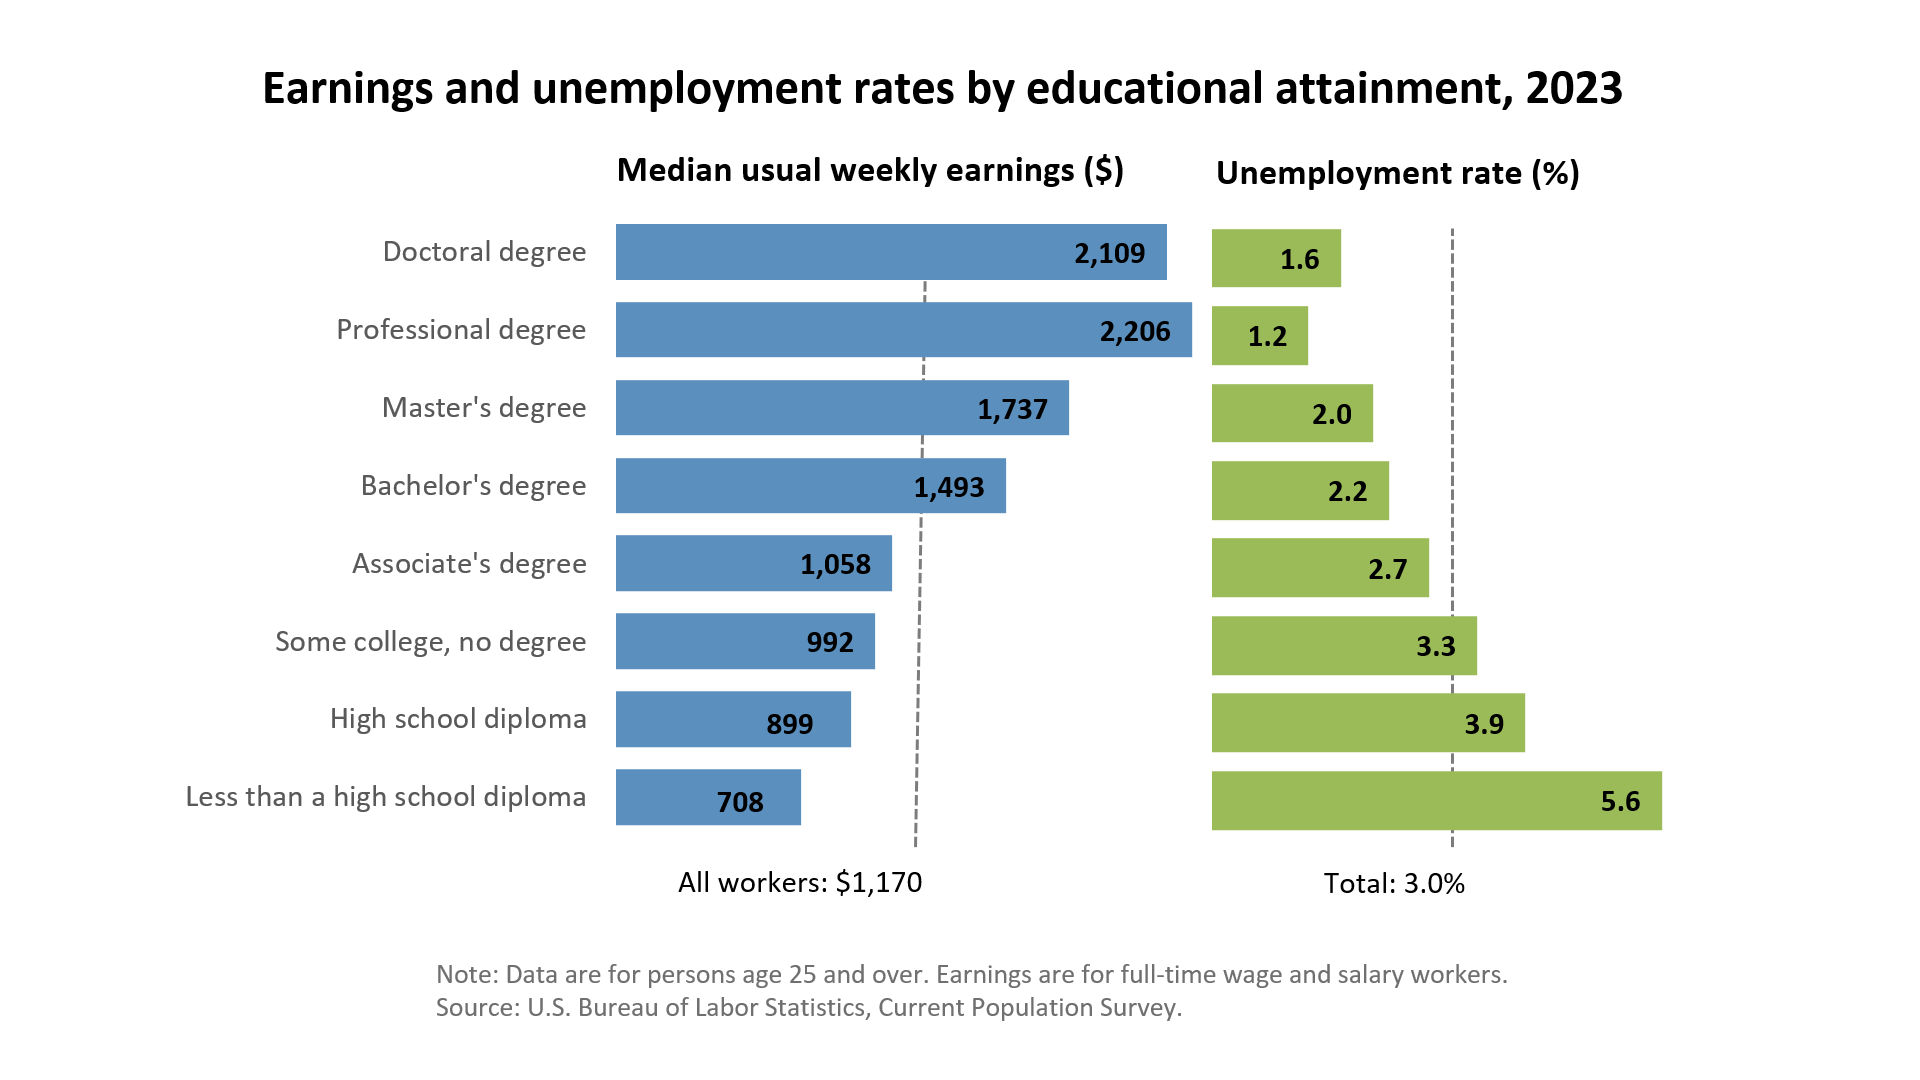
Students who don’t go to college earn an average of $38,792. Their 10-year projected income is $387,920 and the 20-year projected income is $775,840. The difference in incomes is significant. Even with the cost of education being relatively high, students clearly receive a good return on investment.
| Graduates Salary | |
|---|---|
| College Grads Early Career Salary | $83,500 |
| College Grads Average Salary | $106,000 |
| College Grads Mid Career Salary | $161,400 |
| Return on Investment (ROI) | |
|---|---|
| 10 Year Salary Earnings Potential | $1,060,000 |
| 20 Year Salary Earnings Potential | $2,674,000 |
| Cost of Education (Net Price) 4 Year | $69,084 |
| 10 Year Projected ROI | $990,916 |
| 20 Year Projected ROI | $2,604,916 |
| No College Education Salary Comparison | |
|---|---|
| National Average Salary | $38,792 |
| 10 Year Projected Income | $387,920 |
| 20 Year Projected Income | $775,840 |
Related Top College Resources


