Get Matched With Online Colleges
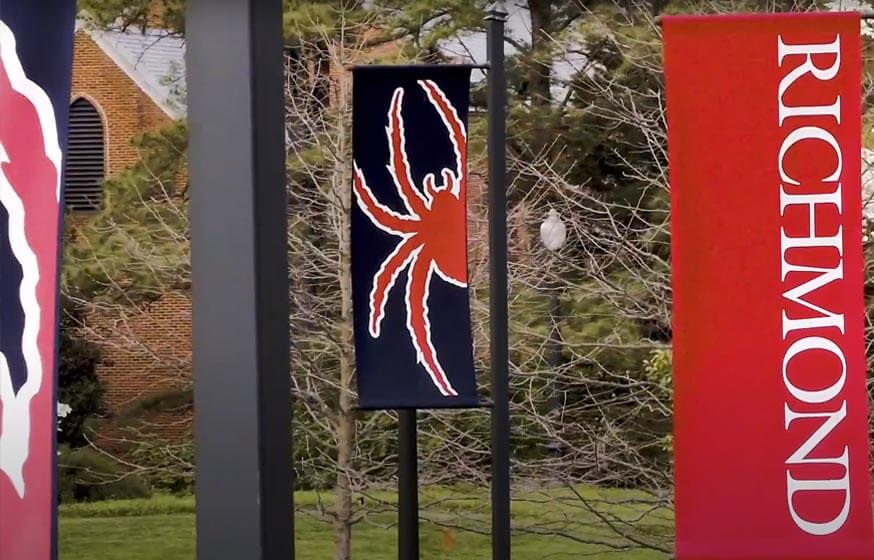
The University of Richmond is a private, non-profit institution that provides the academic and professional foundation for 3,000 undergraduate students and around 700 master's-level scholars. The undergrads have the choice to pursue around 90 various programs in arts and sciences, leadership studies, business, law, and professional and continuing studies. On top of standard classroom education, Richmond students are all eligible to receive a fellowship worth up to $4,000 to fund a summer internship or a research project they co-create with a faculty member.
Search All Programs
Overview of University of Richmond
When not engaged in their studies, Richmond students find that the many campus organizations and recreational activities provide ample opportunity to round out the college experience. There are organizations that focus on academic subjects, such as accounting or social groups, as well as a strong Greek system. Other groups focus on cultural issues, games, and sports.
In fact, students can join an intramural team and enjoy friendly competition in sports such as racquetball, dodgeball, team handball, or table tennis, to name a few. For those who want to raise the level of competition a notch, Richmond offers club sports such as tennis, squash, and lacrosse, among many others. Students can also explore their favorite outdoor activity by participating in the Outdoor Adventure and Recreation Program.
General Information
| School Type | Private not-for-profit |
|---|---|
| Campus Setting | City: Midsize |
| Campus Housing | Yes |
| Student Faculty Ratio | 8:1 |
| Graduation Rate | 89% |
| Year Founded | 1830 |
Student Enrollment
Total Students3,914
3,202
712
Undergraduate Student
Male 1,537
Female 1,665
Graduate Student
Male 342
Female 370
Explore Map
Top Rankings For University of Richmond
URichmond Acceptance Rate and Admissions
APPLICATIONS12,356
ACCEPTANCE3,460
Acceptance Rate28%
Enrollment 830
| Admissions | |
|---|---|
| Application Fee | $50 |
| High School GPA | Required |
| High School Rank | Recommended |
| High School Transcripts | Required |
| College Prep Courses | Recommended |
| Recommendations | Required |
| SAT/ACT | Required |
| TOEFL (Test of English as a Foreign Language) | Required |
| Application Deadline | January 15 |
| Common Application Accepted | Yes |
Tuition Cost & Financial Aid
Since the University of Richmond is a private institution, their tuition rates are more than that of Virginia's publicly funded colleges and universities. For their first-rate academics, University of Richmond charges $56,000 for tuition, books, and fees. Since private schools don't alter their fees for out-of-state students, the gross cost is the same for everyone. When students' room and board expenses are tallied, the total gross cost rises closer to $70,000. However, these figures are adjusted downwards once financial aid packages are accounted for.
The average net cost of a year at the University of Richmond is a stunning $25,000. This figure drops precipitously for lower income students and their families, who see a net cost of $9,000, which rivals some of the lowest-cost state-funded institutions. Households in the top income bracket still receive a significant discount, and their net price is $47,000.
| Average net price | 2018-2019 |
|---|---|
| Net Price | $25,282 |
| Average Total Aid | $41,609 |
| Students Receiving Financial Aid | 64% |
| Room & Board | $12,900 |
Sticker Price
- Tuition In-State - $54,690
- Tuition Out-of-State - $54,690
- Books and Supplies - $1,100
- Room & Board - $12,900
- Other - $1,060
Academics
Students at the University of Richmond are lucky to attend such an esteemed institution, with educational statistics that are among the best in higher education. Two of the chief markers of academic excellence are a school's retention and graduation rates. The retention rate indicates how many first-time, full-time students return to campus for a second year. Graduation rates measure how many students graduate within a four-year, six-year, and even eight-year time frame.
The University of Richmond's retention rate rivals the ivy league. Since 94% of its first-year students return to campus for a second year, it's clear that they are satisfied with their classes, campus resources, and the fellowship opportunities. Perhaps the biggest reason behind these strong numbers is Richmond's student-to-faculty ratio, which yields an average class size of a mere eight students. When these factors are tallied, students and their families see that Richmond promises to provide the foundation they need to thrive later in life.
In fact, University of Richmond does indeed keep students engaged. Their overall graduation rate is a whopping 89% with 84% graduating in four years. In fact, 91% of Richmond's female students graduate within a six-year time frame.
Retention
Rate
4 year
Graduation
Rate
6 year
Graduation
Rate
Student Population Total
Student Population 3,914
3,202
712
Most Popular Programs & Majors
(# of Diplomas Awarded by Subject)
| All Business Majors | 340 Total Graduates / 40% |
|---|---|
| Business Administration and Management, General | 222 Graduates |
| Organizational Behavior Studies | 60 Graduates |
| Accounting | 53 Graduates |
| Human Resources Management/Personnel Administration, General | 5 Graduates |
| All Social Science Majors | 124 Total Graduates / 15% |
| Econometrics and Quantitative Economics | 45 Graduates |
| Political Science and Government, General | 34 Graduates |
| International Relations and Affairs | 17 Graduates |
| Sociology | 11 Graduates |
| All Biological & Biomedical Majors | 84 Total Graduates / 10% |
| Biology/Biological Sciences, General | 54 Graduates |
| Molecular Biochemistry | 30 Graduates |
| Multi/Interdisciplinary Studies | 52 Total Graduates / 6% |
| Multi-/Interdisciplinary Studies, Other | 49 Graduates |
| Cognitive Science | 2 Graduates |
| Ancient Studies/Civilization | 1 Graduates |
| All Psychology Majors | 37 Total Graduates / 4% |
| Psychology, General | 37 Graduates |
| All Other Diplomas | NA |
Outcome & Salary
After graduation, University of Richmond alumni venture forth to achieve great things. In fact, they enter the working world earning hefty salaries. Of the top-earning majors, Richmond’s computer and information sciences majors lead the pack with median salaries of $74,000. Bringing up the lower end, biology majors begin their careers earning $18,000. In the middle of the pack, majors like business administration and human resources report median starting salaries of $53,000 and $42,000, respectively. Since Richmond graduates have such a strong academic foundation, they are all sure to rise through the ranks of their profession and even enroll in top graduate programs. Indeed, the future is bright for people with diplomas from the University of Richmond.
| Graduates Salary | |
|---|---|
| College Grads Early Career Salary | $60,700 |
| College Grads Average Salary | $69,224 |
| College Grads Mid Career Salary | $117,500 |
| Return on Investment (ROI) | |
|---|---|
| 10 Year Salary Earnings Potential | $692,240 |
| 20 Year Salary Earnings Potential | $1,867,240 |
| Cost of Education (Net Price) 4 Year | $101,128 |
| 10 Year Projected ROI | $591,112 |
| 20 Year Projected ROI | $1,766,112 |
| No College Education Salary Comparison | |
|---|---|
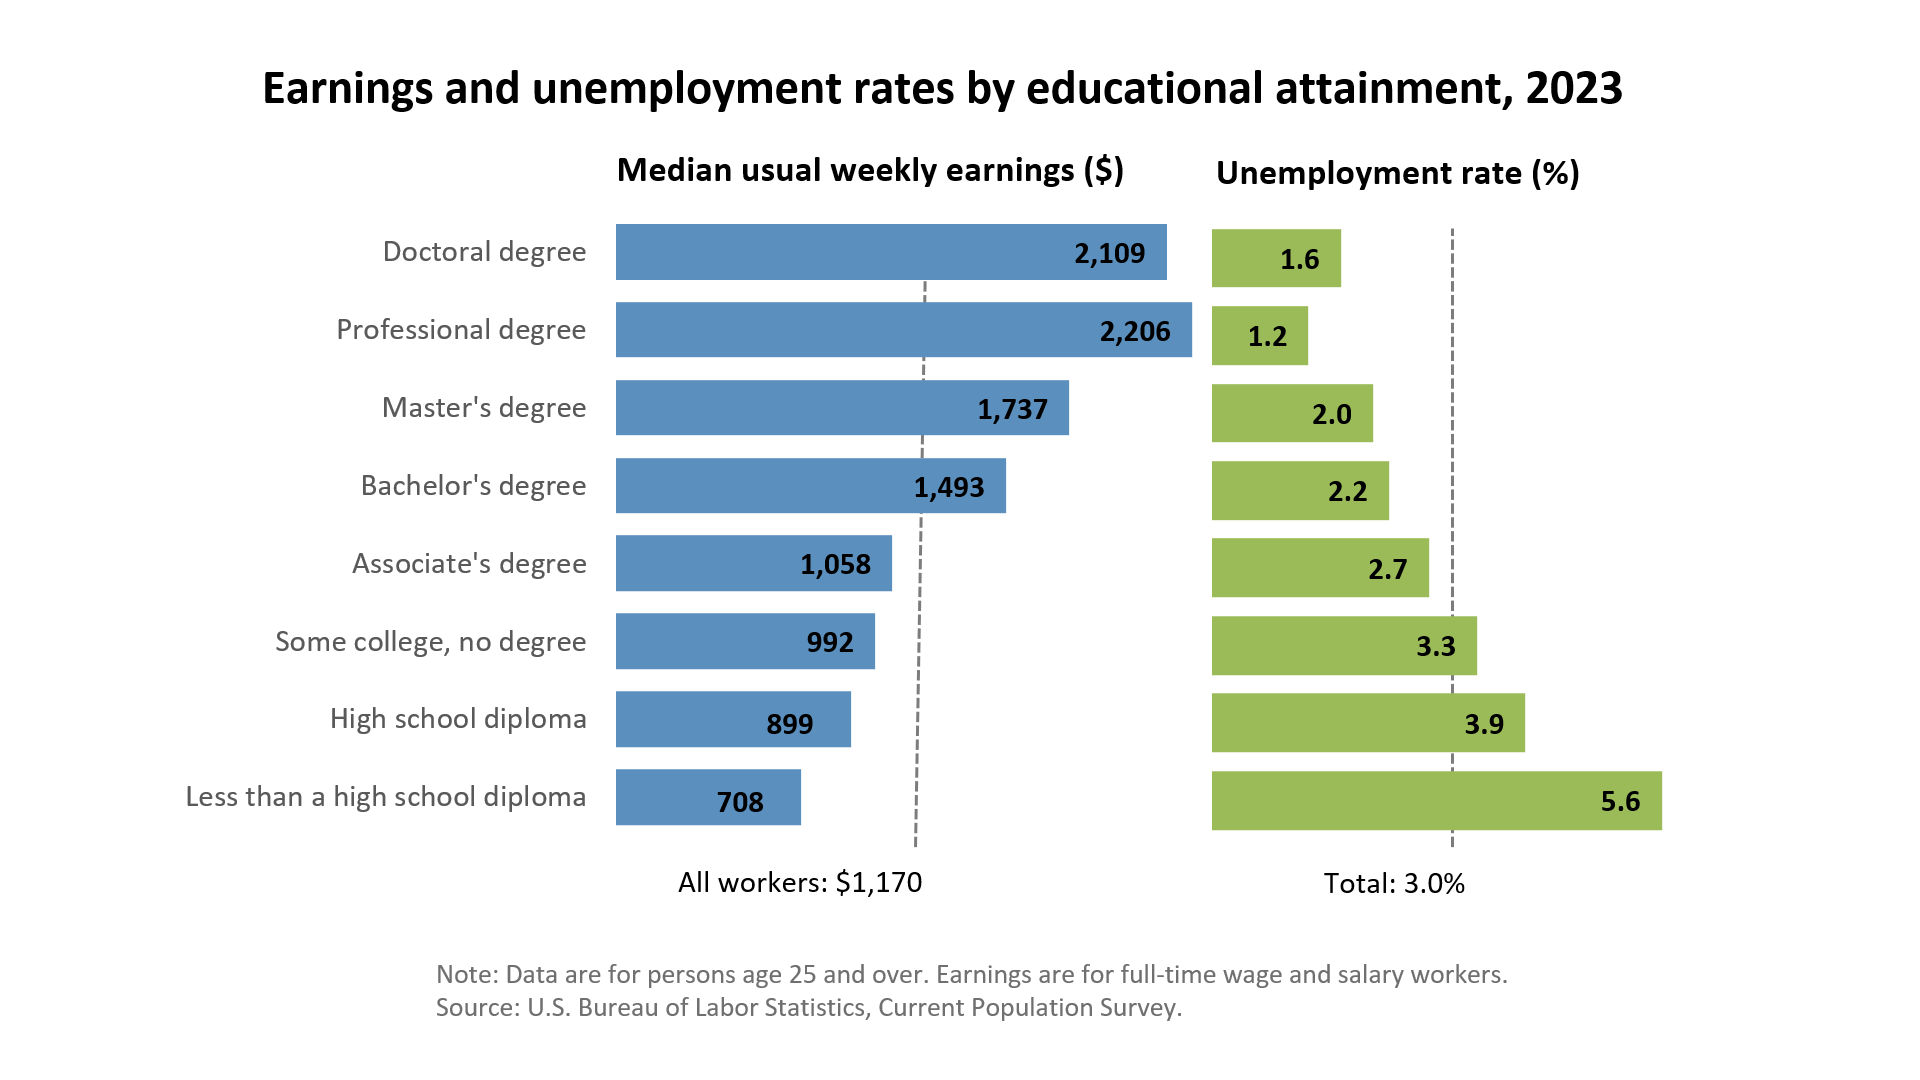
| National Average Salary | $38,792 |
| 10 Year Projected Income | $387,920 |
| 20 Year Projected Income | $775,840 |
Related Top College Resources


