University Headquarters (HQ) is an industry-leading, independent educational organization that provides independent college rankings using a proprietary formula to create first class unbiased rankings. The team at University HQ strives to provide accurate and trustworthy rankings that highlights the best programs.
Get Matched With Online Colleges
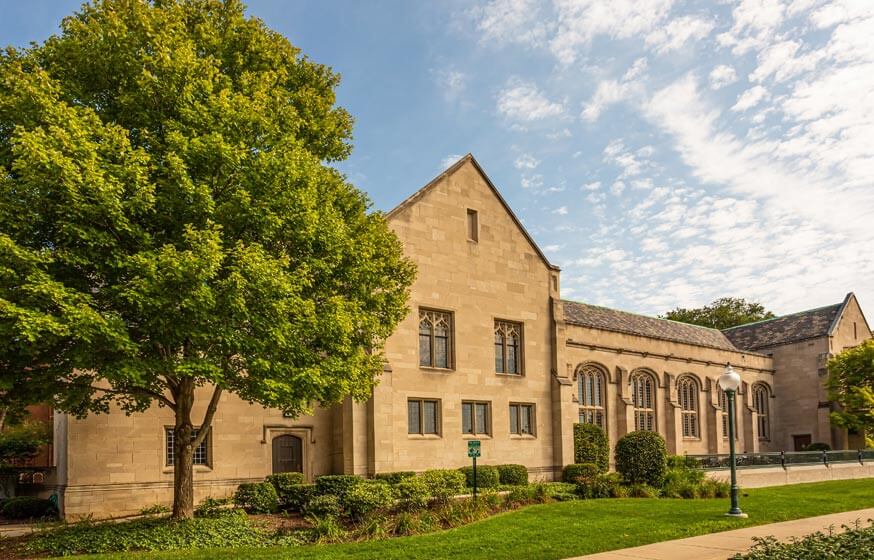
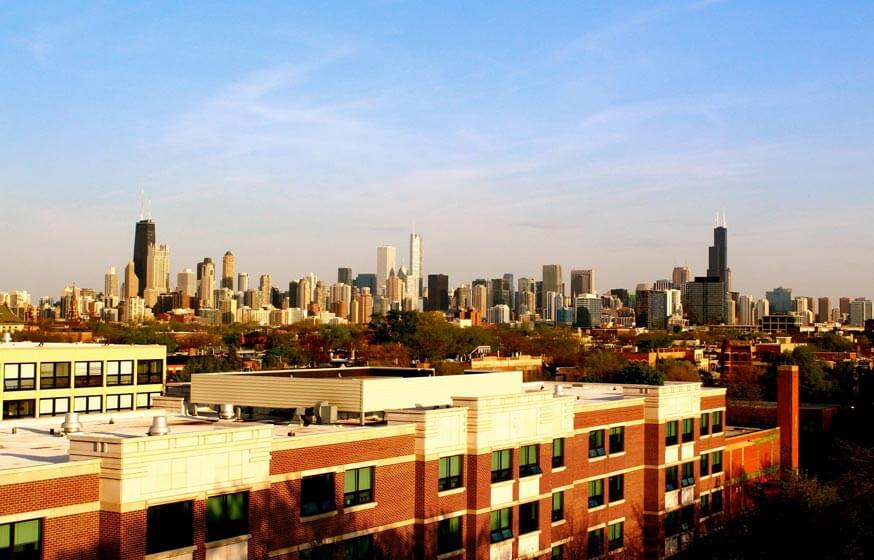
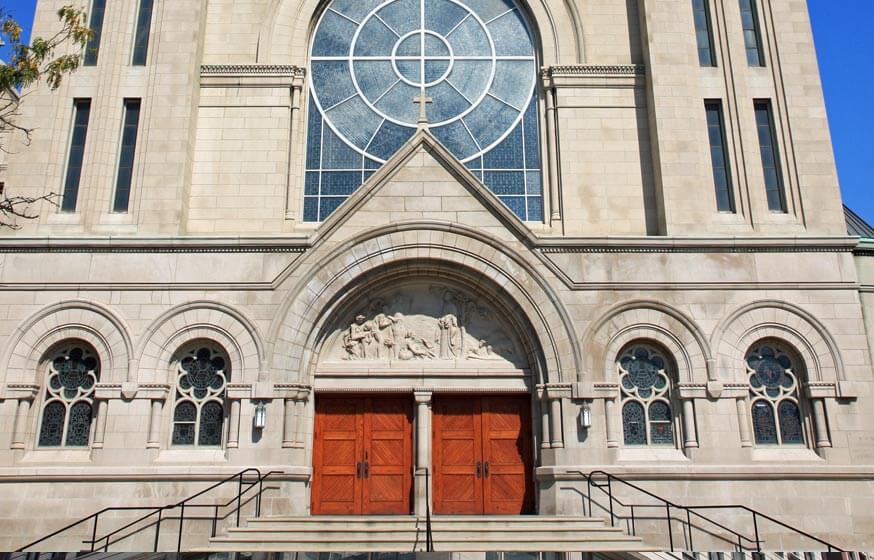
Chicago's DePaul University is located right in the heart of the city. Its tree-lined campus is walking distance to an elevated train stop, Chicago hot dog stands, and Lake Michigan. The 14,000 students that fill its undergraduate classes hail from every state in the U.S. and all are eager to explore Chicago as well as their chosen field.
Search All Programs
Overview of DePaul University
In fact, DePaul students have a lot of options. The 10 colleges and schools support an astounding 300 majors and the class size averages under 40 students. Thus, entry-level classes are bound to be a bit larger but, once students reach the upper level major courses, they find a more intimate learning environment. When they're not studying, DePaul students root on the 15 NCAA Division I teams or find individual ways to enrich their educational experience.
DePaul is home to over 350 student organizations that provide opportunities for student leaders to shine. Students can also engage in fun activities such as E-sports, intramural sports teams, and a campus recreation center with something for everyone. The Ray Meyer Fitness Center & Recreation center is a hub for students who wish to play racquetball, pick up a game of basketball, or swim laps. Students can even sign up for thrilling outdoor adventures. The Ray also provides swimming lessons as well as any sort of fitness class imaginable.
General Information
| School Type | Private not-for-profit |
|---|---|
| Campus Setting | City: Large |
| Campus Housing | Yes |
| Student Faculty Ratio | 16:1 |
| Graduation Rate | 74% |
| Year Founded | 1898 |
Student Enrollment
Total Students22,064
14,214
7,850
Undergraduate Student
Male 6,681
Female 7,533
Graduate Student
Male 3,690
Female 4,160
Explore Map
Top Rankings For DePaul University
Admissions
APPLICATIONS26,895
ACCEPTANCE18,289
Acceptance Rate68%
Enrollment 2,560
| Admissions | |
|---|---|
| Application Fee | NA |
| High School GPA | Required |
| High School Rank | Recommended |
| High School Transcripts | Required |
| College Prep Courses | Required |
| Recommendations | Required |
| Formal demonstration of competencies | Recommended |
| SAT/ACT | Recommended |
| TOEFL (Test of English as a Foreign Language) | Required |
| Application Deadline | February 1 |
| Common Application Accepted | Yes |
Tuition Cost & Financial Aid
Since DePaul is a private university, it needs to charge more for tuition and other costs. However, these higher costs are validated by the terrific academic value. In fact, for a full year at DePaul, the gross price tag for tuition, books, fees, and supplies is around $42,000. One room, board, and other estimated expenses are tallied, students and their families face a cost of just under $60,000. However, this gross price tag is offset by the financial aid packages provided by the Financial Aid Office, who arranges for grants and scholarships that make a huge difference.
Once students receive their financial aid packages, their costs are nearly cut in half. The average net price for DePaul is thus reduced to $32,000. At the lower end, households with income up to $30,000 pay only $26,000. Top income households, which report earnings over $100,000, pay a mere $35,000, inclusive of room and board.
| Average net price | 2018-2019 |
|---|---|
| Net Price | $32,022 |
| Average Total Aid | $24,087 |
| Students Receiving Financial Aid | 98% |
| Room & Board | $14,736 |
Sticker Price
- Tuition In-State - $41,202
- Tuition Out-of-State - $41,202
- Books and Supplies - $1,104
- Room & Board - $14,736
- Other - $2,364
Academics
DePaul University has a lot going for it. It's location in downtown Chicago provides non-Chicagoans with an eye-opening experience on its own, especially for those from warmer climates. The academic experience is what students are primarily on campus for, however. On that note DePaul delivers an outstanding academic experience. To measure how students feel, the best measures are the retention and graduation rates. The retention rate shows what students feel about the school and whether they are interested in a second year. A full 85% of DePaul's first-time, full-time students are thrilled with the professors, classes, and campus resources.
Not only do 85% return for a second year, but the great majority go on to graduate. DePaul reports an overall, and six-year, graduation rate of 74% and a transfer-out rate of 16%. Since transfer students tend to take their transcripts to schools of equal or greater academic quality, it’s evident that DePaul has prepared them for great things.
These strong academic numbers can be attributed to many things such as how the faculty approaches students, the administrations attention to the student experience, or the student-to-faculty ratio. The latter is undoubtedly the more important and DePaul delivers a 16 to 1 ratio which provides students with ample opportunities to approach their professors and even each other in classroom discussion.
Retention
Rate
4 year
Graduation
Rate
6 year
Graduation
Rate
Student Population Total
Student Population 22,064
14,214
7,850
Most Popular Programs & Majors
(# of Diplomas Awarded by Subject)
| All Business Majors | 1,016 Total Graduates / 29% |
|---|---|
| Finance, General | 254 Graduates |
| Accounting | 247 Graduates |
| Marketing/Marketing Management, General | 175 Graduates |
| Management Science | 145 Graduates |
| Communication, Journalism, and Related Programs | 461 Total Graduates / 13% |
| Public Relations, Advertising, and Applied Communication, Other | 244 Graduates |
| Mass Communication/Media Studies | 91 Graduates |
| Speech Communication and Rhetoric | 41 Graduates |
| Journalism | 40 Graduates |
| Visual and Performing Arts | 360 Total Graduates / 10% |
| Cinematography and Film/Video Production | 170 Graduates |
| Graphic Design | 52 Graduates |
| Acting | 27 Graduates |
| Technical Theatre/Theatre Design and Technology | 22 Graduates |
| Computer and Information Sciences and Support Services | 309 Total Graduates / 9% |
| Computer Science | 121 Graduates |
| Information Technology | 57 Graduates |
| Computer Systems Networking and Telecommunications | 42 Graduates |
| Computer Programming/Programmer, General | 29 Graduates |
| Liberal Arts and Sciences, General Studies and Humanities | 280 Total Graduates / 8% |
| General Studies | 280 Graduates |
| All Other Diplomas | 31% |
Outcome & Salary
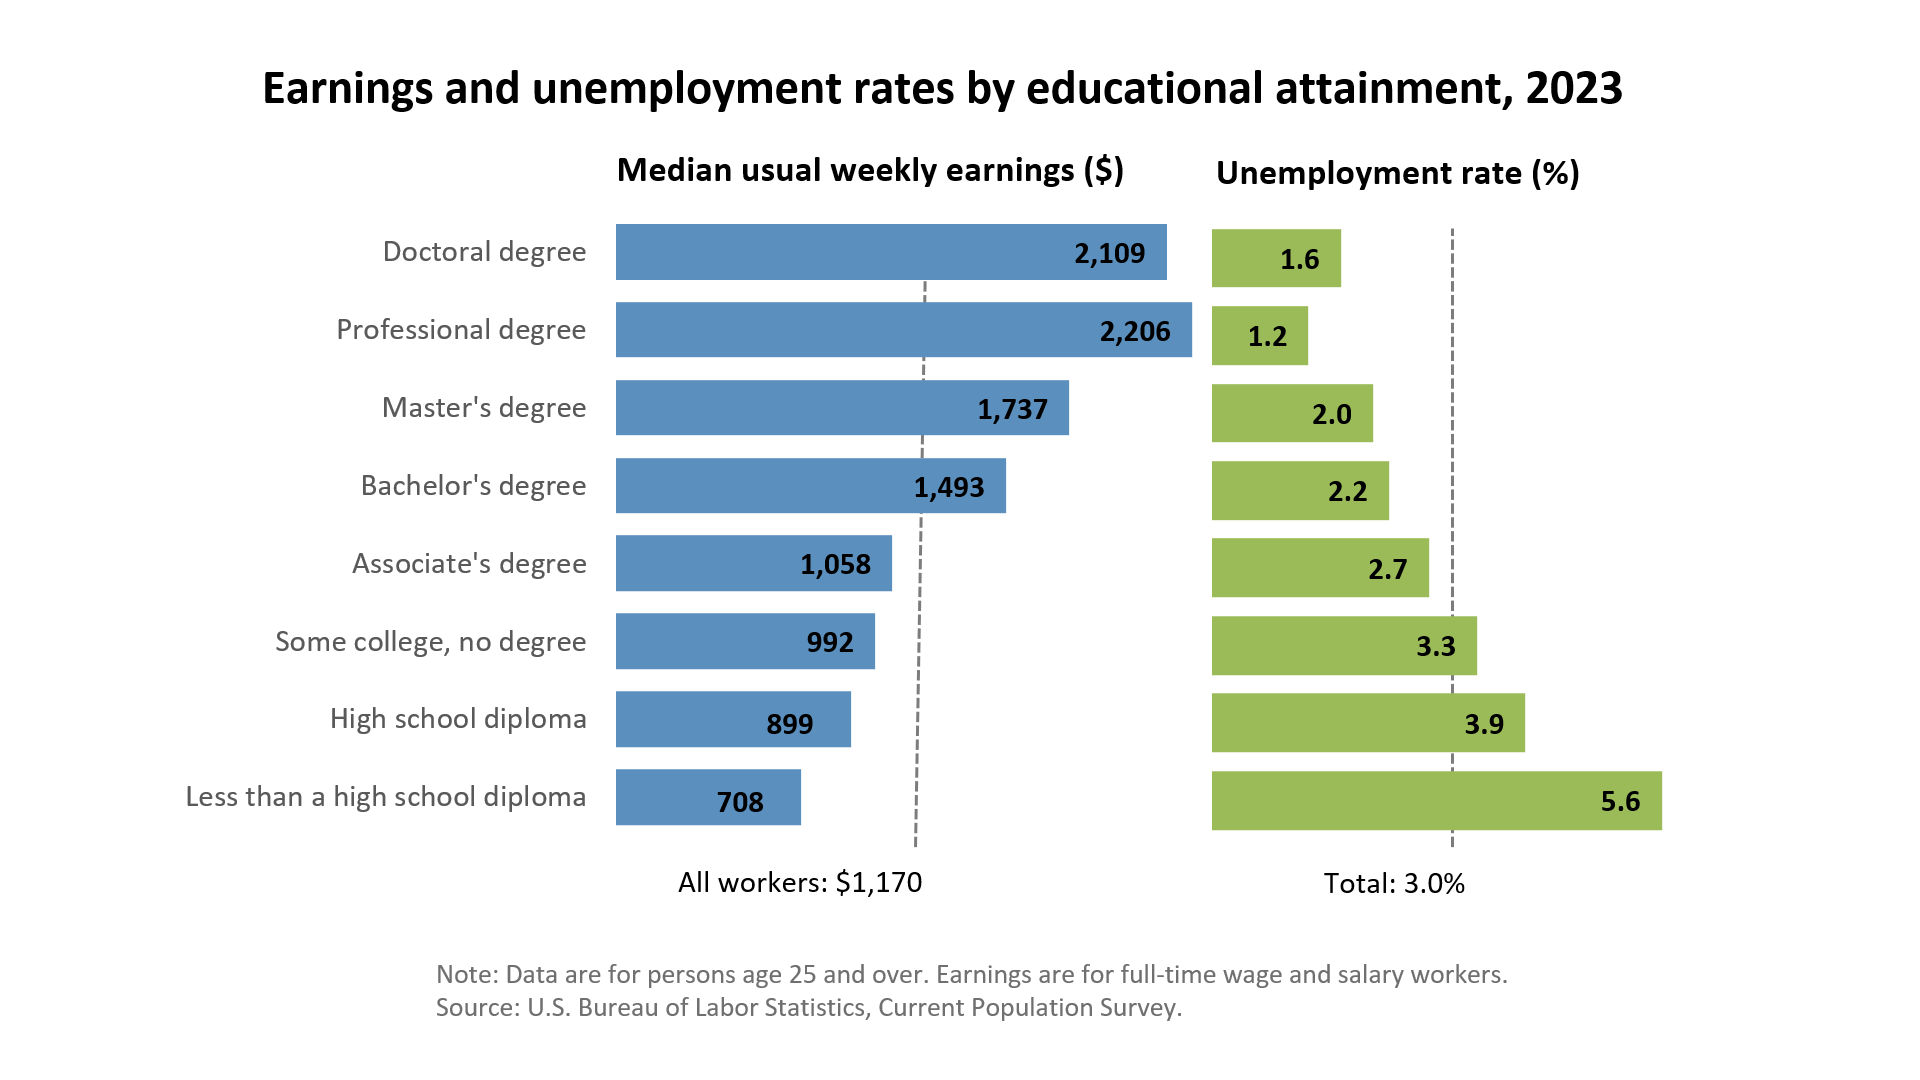
DePaul's 14,000 undergraduate students are all working for one thing – their future. Thus, they are interested in knowing what they can do with their bachelor's degrees, including what sort of salary to expect. While there are no financial guarantees attached to an education, alumni do report earnings relative to their degrees. Of the top-ten earning degrees, DePaul's computer systems grads report the highest median income of $60,000. Of the top ten, the computer and information sciences graduates report the lowest income of $47,000. The remaining top-earning degrees include mathematics, accounting, computer programming, and business/managerial economics.
| Graduates Salary | |
|---|---|
| College Grads Early Career Salary | $55,700 |
| College Grads Average Salary | $69,935 |
| College Grads Mid Career Salary | $102,900 |
| Return on Investment (ROI) | |
|---|---|
| 10 Year Salary Earnings Potential | $699,350 |
| 20 Year Salary Earnings Potential | $1,728,350 |
| Cost of Education (Net Price) 4 Year | $128,088 |
| 10 Year Projected ROI | $571,262 |
| 20 Year Projected ROI | $1,600,262 |
| No College Education Salary Comparison | |
|---|---|
| National Average Salary | $38,792 |
| 10 Year Projected Income | $387,920 |
| 20 Year Projected Income | $775,840 |
Related Top College Resources


